

AI is pushing companies to rethink how they monetize. Consumption and outcomes-based models are starting to replace traditional seat-based pricing, and while this shift may be right for the business, it introduces more complexity and variability when it comes to tracking unit economics. As I've posted about in the past, LTV:CAC simply is flawed.
(In this article, I break down how to calculate CAC Yield. If you want to skip ahead and get started, we've also included a simple, editable template to try out with your own data.)
Why LTV:CAC No Longer Works
LTV:CAC has been around forever. It’s simple to calculate. It’s easy to talk about. But it’s obsolete. It relies on too many assumptions that are stuck in a point in time. It compresses time-based longitudinal data into a static ratio and assumes CAC, churn, contract value, and gross margin are all constant. Especially for early-stage companies, all of these variables change. Constantly.
With constant change, how do we know the ROI of our CAC investments?
Introducing CAC Yield — a dynamic, granular way to measure CAC efficiency across any pricing model, at any point in time.
CAC Yield is a more dynamic way to measure how your sales and marketing investments perform over time regardless of pricing model.
Here’s the core idea: CAC Yield is your return on CAC measured by any unit of time, for example, CAC Yield by month - it’s a cohort’s monthly revenue as a percentage of the Cohort CAC (CCAC). Think of CAC like a discrete investment made to acquire a set number of customers in every cohort, and each month that cohort of customers is generating a return.
For example, if you spend $120K in sales and marketing in January and acquire a cohort of customers that generates $10K in revenue per month.
The CAC Yield is:
$10,000 ÷ $120,000 = 8.3%.

That 8.3% number tells you: for every dollar spent acquiring these customers, that customer cohort is returning 8.3% of the investment made to acquire them (CAC)
Now we can extend this for every month of every customer to track the CAC Yield. Month 2 or month 20 or month 43. The goal is to see consistency and ideally improvement but can be measured over any amount of time.
Why CAC Yield Works
CAC Yield gives you something that other metrics don’t: a consistent, month-by-month view is your sales and marketing efficiency, regardless of pricing model. It doesn’t rely on static assumptions or theoretical numbers. It adapts with your business. If churn hits and revenue goes down, the yield drops. If expansion kicks in and there’s upsell revenue, yield climbs. If your CAC balloons because of a campaign that didn’t land, the yield will show it.
It’s granular. And I’d argue it’s the only accurate way to track sales and marketing efficiency in an AI-first world where variables are changing all the time.
And it gives you the right frame for thinking about scaling. You don’t need to rely on a theoretical ratio to justify growth. You can see if each cohort is generating a positive return on investment to determine how fast or slow to go..
While CAC Yield may look similar to a net retention curve, it measures something different. Net retention tells you how customer revenue changes over time, CAC Yield puts that revenue in context of what you spent to acquire it.
What about sales cycle and lumpy CAC?
In practice, while it can be helpful to check CAC Yield every month to stay close to your performance, I’d recommend measuring yield on a rolling 3-month basis to present a smoother picture and avoid lumpiness that can occur within a quarter. And it’s important to offset the Yield by the sales cycle.
CAC Yield Benchmarks
Once you start tracking CAC Yield, the shape and trajectory of the curve will tell you a lot ie. how profitable is your CAC?
Here's a simple guide to interpreting CAC Yield over time:
|
Yield Range |
What it Means |
|
8%+ |
Healthy: sales and marketing efforts are efficient and investments are generating a strong return. Potentially invest more. |
|
5 - 8% |
Needs Improvement: cohorts aren’t generating enough of a return to say go faster. Growth may be stalling, and burn relative to growth is too high. |
|
<5% |
Inefficient: CAC is not generating a return and these investments are potentially losing money for the business. |
What a Healthy CAC Yield Curve Looks Like
Now let’s look at examples of each scenario:
 Healthy (8%+): It’s important to note that Yield curves may start low as customers ramp up adoption which is very normal. But by month 4-6, it hits 8% and continues to increase. At an 8% CAC Yield, that translates to roughly a 1x return every 12 months, which is consistent with a 1-year CAC payback. The higher the yield, the better.

Low Yield (3-5%): Yield averages 3-5% and isn’t rising. Maybe customers aren’t growing, or churn is outpacing cohort expansion. It’s a signal to run an assessment on your sales and marketing spend before proceeding to invest more.

Declining (1-3%): Yield is low (1–3%) and decreasing. This means STOP because the sales engine is highly inefficient, and something isn’t working. Diagnose, retool, and try again before re-investing in GTM.
Let’s look at two examples of Healthy vs. Struggling CAC Yield
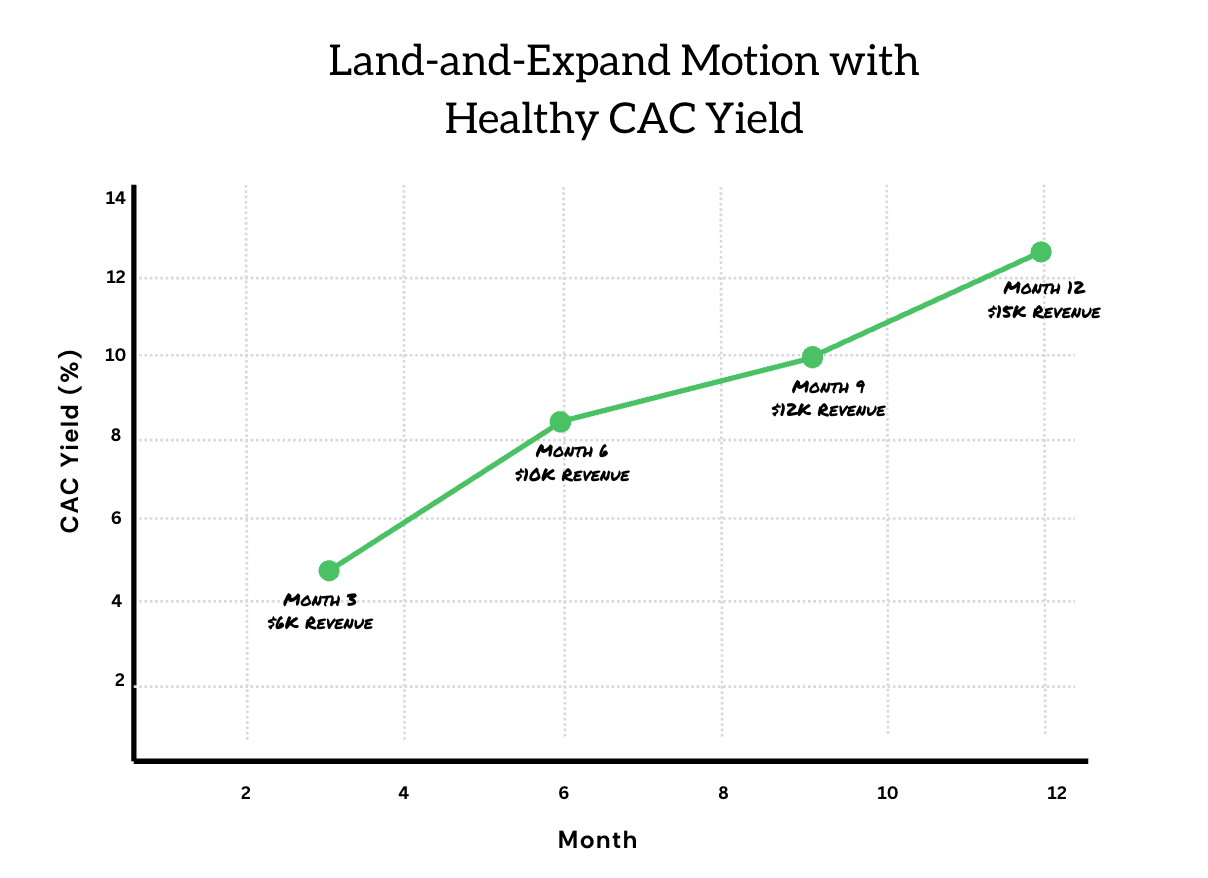
Scenario 1: Land-and-Expand Motion with Healthy CAC Yield
*Assumes a 1-month sales cycle and monthly yield curve
In the beginning, it looks modest:
- In Month 3, revenue is $6K → CAC Yield = 5%
But over time, they expand:
- In Month 6, revenue grows to $10K → CAC Yield = 8.3%
- In Month 9, revenue is now $12K → CAC Yield = 10%
- In Month 12, revenue is at $15K/month → CAC Yield = 12.5%.
This example is of a land-and-expand motion. Even if early returns look small, CAC Yield improves as customers scale and deepen usage. Each month, the CAC Yield improves:
CCAC = $120K
|
Month 3 |
Month 6 |
Month 9 |
Month 12 |
|
|
Revenue in Month |
$6,000 |
$10,000 |
$12,000 |
$15,000 |
|
CAC Yield |
5% |
8.3% |
10% |
12.5% |
This is a healthy curve: the sales and marketing investment is generating increasing returns.
Scenario 2: Declining Yield
Now, take another cohort acquired in February with a CCAC of $120K. By month 3, MRR is $15K, or 12.5% yield.
But instead of expanding revenue plateaus. Churn creeps in. By Month 6, they’ve dropped to $12K/month, and by Month 9, it’s $5K/month.
The yield curve looks like this:
CCAC = $120,000
|
Month 3 |
Month 6 |
Month 9 |
Month 12 |
|
|
Revenue in Month |
$15,000 |
$12,000 |
$5,000 |
$3,500 |
|
CAC Yield |
12.5% |
10% |
4.2% |
3% |
The yield started out strong but degraded quickly. That’s a yellow-to-red light. Something’s not working — maybe something with product adoption or finicky customers.
It’s important to note that some motions, like enterprise land-and-expand, will start with low yield and grow. Others, like SMB with high churn, may start higher but flatten. That’s okay. The key is seeing the shape of the curve and asking: is this compounding, or is it deteriorating?

When Should You Track CAC Yield?
While CAC Yield is most useful for spotting trends over time, you don’t need to wait until you have a full year's worth of data. My advice is to start tracking early, even with limited data. Get in the habit now so you’re ready to spot meaningful patterns at the 6- or 12-month mark. So what if you’re not quite at the scale mode and still at product-market fit? Focus instead on Leading Indicators of Retention (LIRs). These help you understand whether users are engaging with your product in ways that correlate to long-term success.
Getting Started with CAC Yield
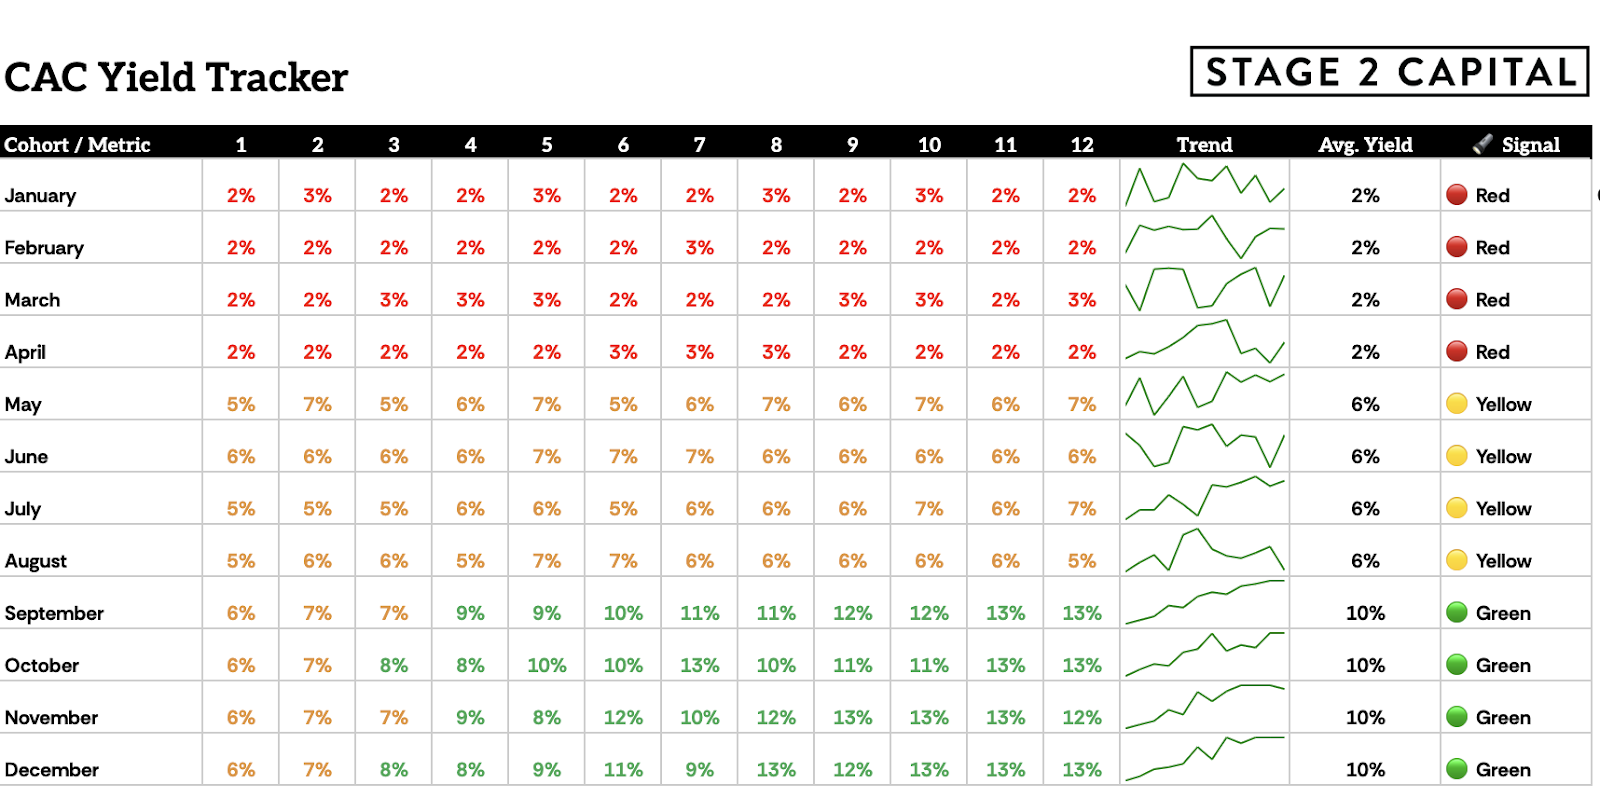
Tracking CAC Yield isn’t complicated, but it does require that you measure on a regular cadence.
You can get started with a simple spreadsheet. Each month, add a new row for the most recent cohort of customers. For that cohort, log:
- The fully loaded CAC — this includes all sales and marketing spend tied to acquiring that cohort (or use a 3-month rolling CAC average if spend is lumpy).
- The monthly revenue that cohort generates — update this each month to reflect how revenue expands (or contracts).
What to Do If Your Yield Is Low
Let’s say your CAC Yield is 2% and not improving. Now what?
This is your red light. You may want to pause the machine, or at least stop aggressively scaling it. Dig into the metrics behind the data to work your way back to the source of the low yield. Remember, it may be a combination of things.
- Is CAC too high? Look at channel mix, rep productivity, sales cycles, and win rates.
- Is revenue contribution too low? Consider pricing/packaging, onboarding speed, time to go live.
- Does the CAC Yield increase? Sometimes customers take time to ramp up and fully adopt the product. If the Yield increases, it may turn to a green light, but you need to observe closely that the yield is indeed going up.
- Is this one bad cohort — or a pattern? Use rolling averages and compare across segments to know if you can see a trendline.
Ready to track your own CAC Yield?
We’ve created a simple, editable template so you can plug in your own numbers and start visualizing CAC Yield by cohort. > View Template