.png?width=760&height=550&name=Copy%20of%20GTM%20Playbook%20eBook%20cover%20(1).png)
When it comes to achieving product-market fit (PMF), our firm is committed to looking at product usage data v. simply ARR growth as a signal of customer health. Product usage can serve as valuable insights into customer retention, acting as what we refer to as leading indicators of retention (LIR).
As seen in Science of Scaling, Mark Roberge shares this format for defining your leading indicator of customer retention:
[Customer Success Leading Indicator] is “True” if P% of customers achieve E event(s) every T days.
- P is the percentage of customers that achieve the leading indicator.
- E is the actual event or set of events that represents the leading indicator.
- T is the time by which the leading indicator event is achieved.
An example from the early days of HubSpot: 80% of customers use 5 features out of the 25 features in the platform every 60 days.
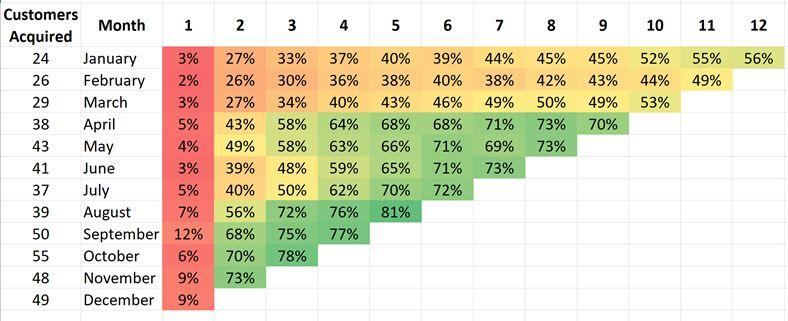
This approach will help you confirm product-market-fit, and understand the customers that are in danger / churning, to help refine ICP by looking at the percentage of customers achieving Customer Retention Early Indicator:
But, what if you're a growing business with a small customer base (less than 15 customers) and you're selling enterprise contracts with a high annual contract value (around $50,000)? You'll probably find yourself lacking sufficient data to conduct cohort analysis.
Enter — The LIR Journey
If your business is only acquiring a few customers each month, conducting a cohort analysis may not be the most effective approach. Instead, we suggest embarking on a journey of customer level tracking, progressing to quarterly cohorts, and eventually transitioning to the monthly cohorts mentioned earlier.
The LIR Journey: Customer Level LIR
As a first step in your LIR journey, we recommend establishing and tracking a product usage metric at the customer level. If you are acquiring <5 customers/period start by measuring a few things:
- Is the customer in your currently defined ICP? Yes/No
- A product usage metric you expect will align with retention
- Bonus:
- # of support tickets and/or bugs reported
- Expected and actual date of go live (creates a sense of urgency, especially for enterprise products)
We’ve built 3 options for customer level LIR and created templates to help you track your progress. Download the template here and read on for details on how to use them.
The first step is to select one metric that is indicative of a customer deriving value and commit to reviewing it monthly. Examples might include:
- % of purchased users logging in
- # of features/modules accessed
- # of actions taken
Once you’ve picked the metric, you must decide what you are measuring it against:
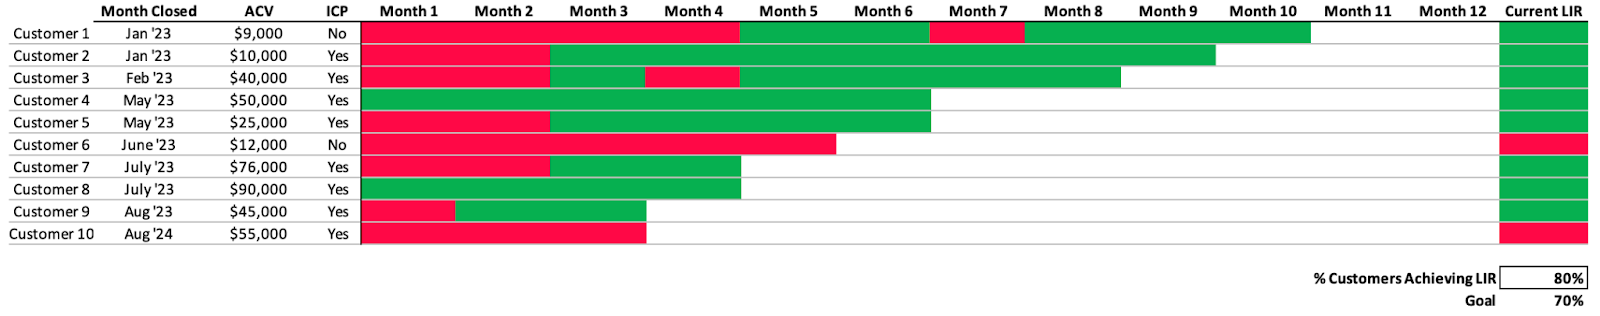
Option 1: Static threshold
Using # of actions as our example, our hypothesis is that once a customer does 5 actions they are building a repeatable habit, deriving value and will likely continue to do it. Each month evaluate each customer and color code them red or green based on performance against the threshold (5) you set. By tracking this on a monthly basis we can see if a perceived healthy customer suddenly stops doing the expected actions and intervene accordingly. Similarly we can track our progress over time with the goal of shortening time to value for a customer. Over time we will be able to test this hypothesis against retention data to ensure we have the right threshold and timing:
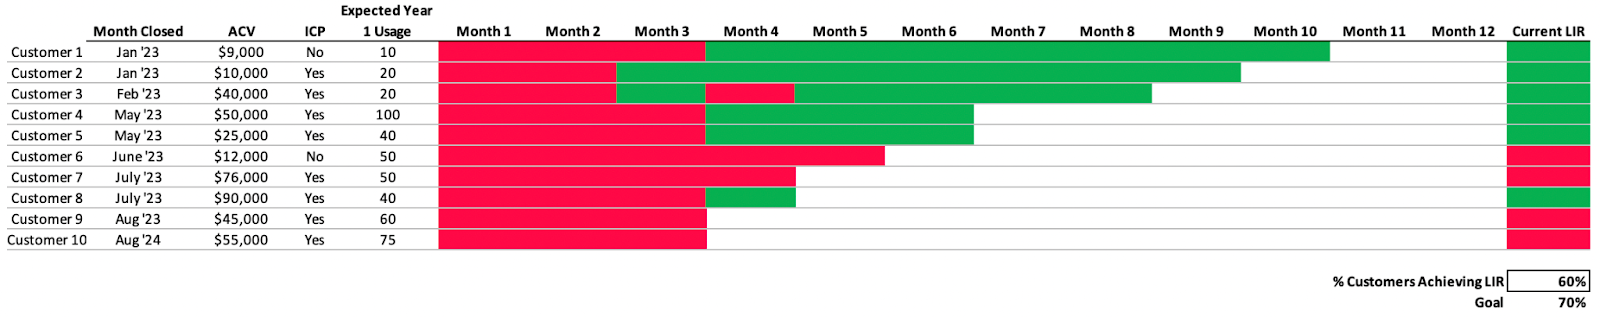
Option 2: Static % attainment at customer level
Given customers have different use cases and end states, you might try to predict year 1 usage up front (note new column) and track each customer’s journey against thier own goals. In this case we set a static threshold of 25%. In each month we check if usage has exceeded 25% of the customer’s target usage for the year and code as red/green:
Option 3: Variable % attainment at customer level
As you evolve and learn more about how product usage aligns to customer value and retention, you might consider increasing the sophistication of the static % LIR by setting progressive monthly % attainment targets. Here we set a goal of 10% by the end of month 1, 15% end of month 2, etc… By taking the size of the customer and their goals into consideration we are building a more nuanced view of usage:
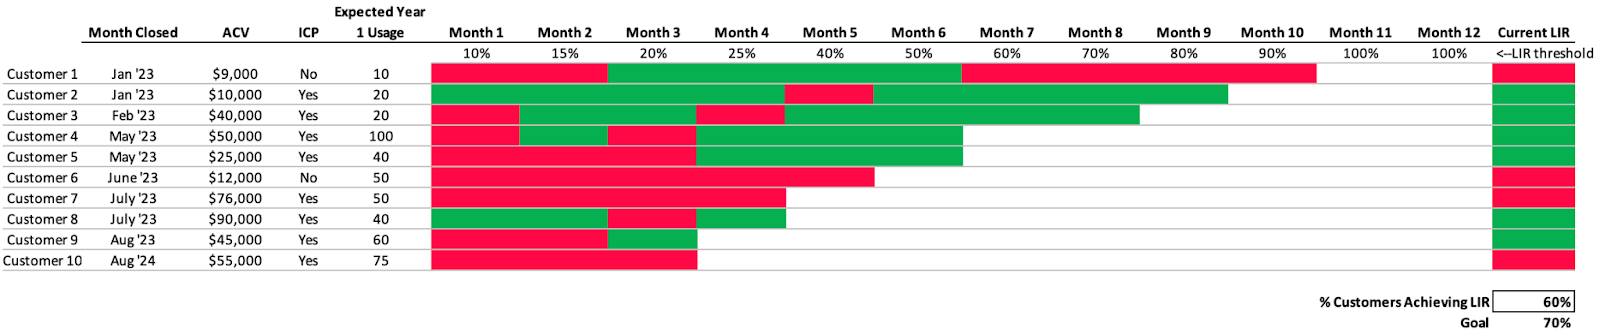
Across all 3 options you will notice a final column titled “Current LIR”. Our templates are designed to track the current status of each customer so you can quickly see an aggregate view of the customer base. The assumption is that more established customers should more consistently achieve the LIR, but you can boil this entire analysis down to one number by setting a goal like “70% of customers to achieve LIR in current month”. You might also consider looking at Month 1, Month 2, Month 3, etc…LIR attainment to see if you are improving over time - while this is valuable as a trend, we believe the “current month” is critical to assess the health of your customer base.
Finally, by tracking ICP (Yes/No) over time you can filter these metrics to understand how your LIR compares between ICP and non-ICP customers.
The LIR journey: Graduating to Cohorts
When you are consistently acquiring 5+ customers per quarter, we recommend moving away from customer level tracking (cumbersome at this scale!) and instead shift to a quarterly cohort view.
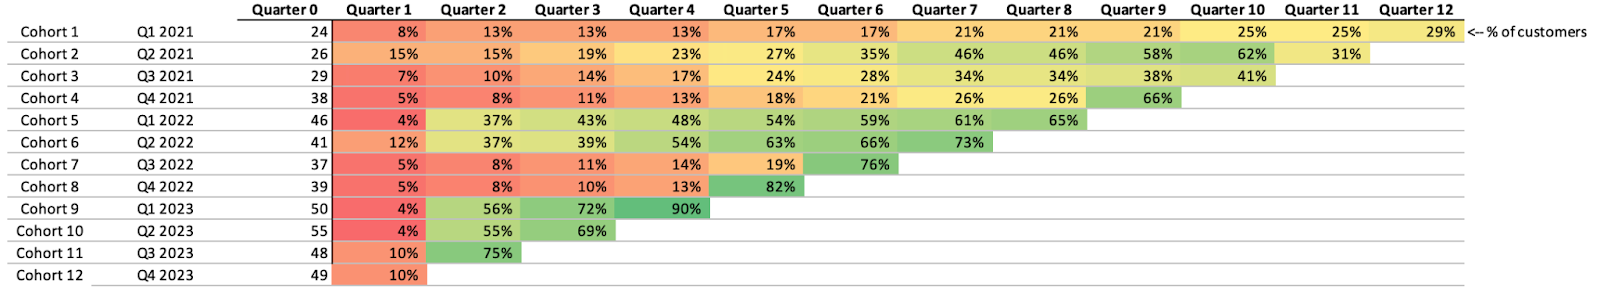
And as you continue to accelerate customer acquisition to 5+ new logos per month, you can eventually graduate to the monthly cohort model.
Our #1 piece of advice — start tracking something today. Keep it simple and don’t get bogged down in creating a multi-dimensional customer health score. Boil it down to the product usage metric most closely aligned to value and therefore revenue.
You can always iterate on this process in the future — pick a product usage metric that is simple, easy to report on/instrument and commit to reviewing it monthly. And use this template to get started: