The Science of Scaling
"When to scale?" and "How fast?"
These two questions are mission critical for startup organizations. Yet, as entrepreneurs, we lack a rigorous approach to answering them.

Save this content for later

Introduction
Look at the diagram below. The upper right is optimal. It represents exceptional revenue growth and exceptional customer retention. However, if you had to choose between path A or B, which would you prefer?
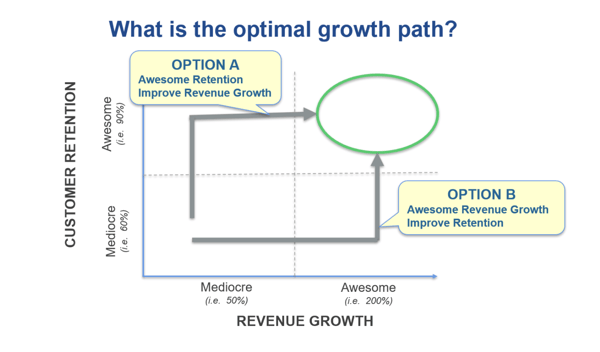
I posed this question at the 2019 Annual Saastr Conference in Silicon Valley. The audience almost unanimously chose Option A.
I called B.S. I agree with the choice. I don’t agree that, as entrepreneurs, we follow it.
Why? As entrepreneurs, the first metric we mention when describing our business is revenue. As investors, the first question we ask is about revenue growth. In board meetings, the first slide shown illustrates revenue. “Triple. Triple. Double. Double.” This phrase, meaning triple revenue in year one and two then double revenue in year three and four, is the perceived blueprint for future unicorn status. We don’t prioritize customer retention. We are obsessed, almost out of the gate, with revenue growth. And it’s killing our businesses.
Startup failure is unnecessarily high due to a premature obsession with top line revenue growth.
I’m not saying grow slower. I’m saying grow healthier. In all fairness, we have improved as entrepreneurs over the last decade. Thanks to the amazing thought leadership by Eric Reiss and Steve Blank on lean startup methods and agile development, we no longer lock ourselves in a room for a year to build a product and then cross our fingers hoping it will sell. Instead, we navigate from idea to solution by co-creating with customers, developing MVPs, and navigating test/learn/iterate cycles as we pursue product-market-fit.
Applause. We have grown as an entrepreneur community.
However, it is at that moment where we lose our way. Once we hit that supposed product-market-fit, we raise a Series A, hire 10 salespeople, and attempt to “triple, triple, double, double”.
Instead we “strike out” 80% of the time. It’s unacceptable.
We are scaling haphazardly rather than scientifically. Great businesses with noble missions fail because of inadequate answers to the following two critical questions:
- When to scale?
- How fast?
We as entrepreneurs have much to gain from a more scientific, data-driven approach to these two questions. I sincerely believe a more rigorous approach will unlock a higher success rate of Series A funded startups.
After peering inside the go-to-market machinery of hundreds of startups, I found the following five issues as the most common diagnoses for missed revenue targets in Series A funded businesses:
- Premature focus on top line revenue generation in lieu of consistent customer value creation
- Inadequate, non-data-driven definition of product-market-fit
- Misunderstanding of go-to-market capabilities needed before hiring salespeople
- Front-loading sales hires at the beginning of the year rather than pacing throughout the year
- Confusing temporary competitive advantage with sustainable competitive advantage
Reflecting on these common issues, I have been using the following framework to guide entrepreneurs and their new ventures through a more calculated approach to scale.

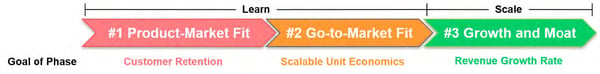
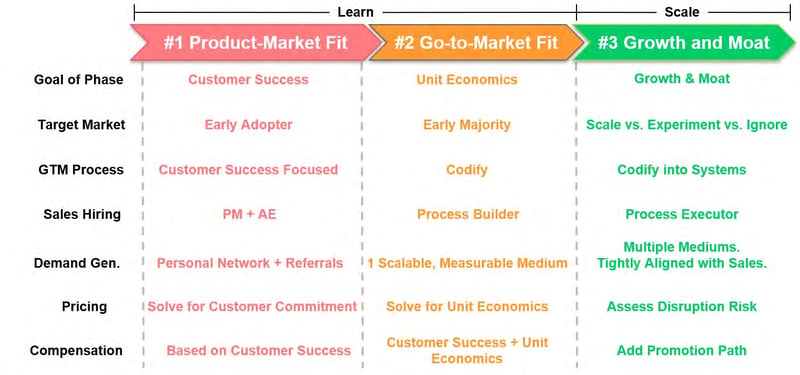
The framework has three sequential stages:
- Product-Market Fit, defined as generating customer success consistently
- Go-to-Market Fit, defined as generating customer success consistently and scalably
- Growth and Moat, which provides a scientific approach to the pace and defensibility of scale
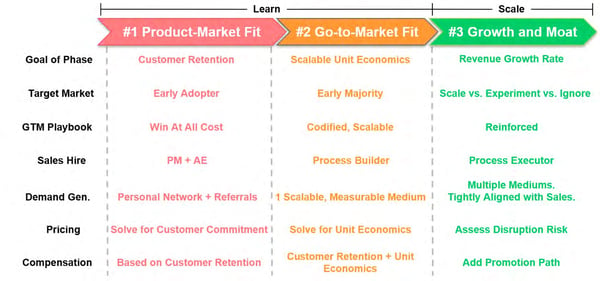
The framework includes quantifiable milestones defining when stage achievement occurs...
...and illustrates how key go-to-market decisions, such as price, hiring profiles, demand generation channels, and sales process, evolve as progress is achieved.
The remainder of this eBook is organized by the three stages of the framework, elaborating on the definition, measurement, and optimal execution required in each. Remember, the overarching mission is not slower growth, but healthier growth. The goal is not a short term “triple, triple, double, double” but a long term “home run”.
Phase 1: Product-Market-Fit
Section Summary
- We use “product-market-fit” to make critical decisions such as when to scale. However, we lack a scientific, data-driven definition of the term.
- Customer retention is the best statistical representation of product-market-fit. However, customer retention is a lagging indicator.
- Assuming long term customer retention is the best statistical representation of product-market-fit then:
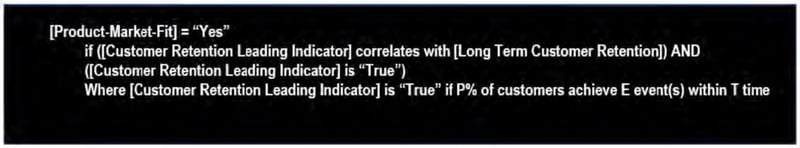
- Organizing our customers into acquisition cohorts and measuring their progress toward the customer retention early indicator enables early identification of product-market-fit.
We use “product-market-fit” to make critical decisions such as when to scale but we lack a scientific, data-driven definition of the term.
“What is product-market-fit?”
Every year, I challenge my students at Harvard Business School with this question. I find it intriguing that for a term that is so well socialized throughout the entrepreneur ecosystem and so critical to determining when to scale, it has such a varied, non-rigorous definition. Well versed students reference Marc Andreessen’s definition, “being in a good market with a product that can satisfy that market”, but worry the definition leaves too much up to subjective interpretation, especially with regard to the words “good” and “satisfy”. Other astute students reference Sean Ellis’ quantitative approach of “at least 40% percent of surveyed customers indicating they would be "very disappointed" if they no longer had the product”. However, students referencing this approach worry that data gathered in a customer survey may be corrupted with false positive risk.
So, how can we take a more data-driven, scientific approach to product-market-fit?
I find “better-in-class” companies use long term customer retention as an indicator of product-market-fit. The idea is to “let the customer’s wallet do the talking”. The argument is a customer’s decision to renew or repeat purchase is the most factual, true positive indicator of their satisfaction with the product and, in turn, product-market-fit. In aggregate, the tech sector considers an annual customer retention rate above 90% to be the world class benchmark. Therefore, we can argue that companies have product-market-fit when annual customer retention exceeds 90%.
We are getting closer. I agree customer retention is the best statistical representation of product-market-fit. However, customer retention is a lagging indicator. It often takes quarters or even a year for companies to understand the true retention rate of customers that we acquire today. We do not have years or even quarters. Time and money, especially in an early stage setting, are not on our side. We need to test, learn, and iterate in much faster cycles.
For this reason, “best-in-class” startups use a leading indicator of customer retention to quantify product-market-fit. Some entrepreneurs in Silicon Valley refer to the leading indicator as the “ah-hah'' moment. If the leading indicator is objective, rather than subjective, and truly correlates with long term retention then we have defined a data-driven, time-sensitive approach to understanding product-market-fit.
Defining the leading indicator(s) of customer retention
Unfortunately, there is not a single leading indicator of customer retention definition universally applicable to all company contexts. However, the following definition framework is universally optimal.
[Customer Success Leading Indicator] is “True” if P% of customers achieve E event(s) within T time
Documented examples of leading indicators from modern day unicorns, organized in this format, are below.
- Slack: 70% of customers send 2,000+ team messages in the first 30 days
- Dropbox: 85% of customers upload 1 file in 1 folder on 1 device within 1 hour
- HubSpot: 80% of customers use 5 features out of the 25 features in the platform within 60 days
We have deduced the question of product-market-fit to the values of P, E, and T. Below are best practices on defining these variables for our business.
P is the percentage of customers that achieve the leading indicator. If P is surpassed, we have product-market-fit. But what is an acceptable P? Evaluating the extremes, 5% seems way too low. If we acquire customers and only 5% achieve our leading indicator of retention, that will be a terrible foundation for a business. At the same time, 95% seems way too high. The primary reason for this analysis is determining when to scale. Waiting until 95% of customers achieve the leading indicator seems too cautious, exposing us to the risk of waiting too long and missing the market opportunity or losing unnecessary ground to a competitor. A final consideration is the market’s perception of strong annual customer retention, which we previously mentioned is 90%. With all of these considerations, I often see P set at between 60% and 80%. I recommend the lower end of the spectrum if the company sells to small businesses and the higher end if the company sells to large businesses. Because we will instrument and continually monitor the metric on an on-going basis, I don’t believe that a debate on whether P should be 60% or 70% is productive. If we truly have found product-market-fit, we will find that the percentage continually improves even after we have moved to the next phase of scale.
E is the actual event or set of events that represents the leading indicator. Events around product setup, usage, and results are commonly used. E is the most important variable to think through. I recommend the following considerations when defining our leading indicator:
- Objective: The event should be factual and binary. It either happened or it didn’t. There is no subjectivity or room for interpretation. “Processed the first transaction” is objective. “Customer sees value” is not.
- Instrument-able: We need to be able to automate the measurement of the event. Later in the eBook we will demonstrate why it is important to continually measure the leading indicator as the company scales to assess whether product-market-fit is lost. Therefore, it will be important to instrument the measurement of the leading indicator prior to scale. “Logging in at least once per day” is instrumentable. “Mentions of the product in executive meetings” is not instrumentable.
- Aligned with customer success and/or value creation: Intuitively, creating customer value and success will lead to customer retention. Not doing so will lead to churn. Therefore, leading indicator events that represent customer value and success are recommended. “10% reduction in processing time” represents customer value. “Signed the contract” does not.
- Correlated to the company’s unique value proposition: The go-to-market team will be focused on driving leading indicator events in the new customer base. Marketing will be focused on driving awareness with segments where leading indicator achievement is easiest. Sales will be focused on convincing prospects that the leading indicator events are most important. The customer success team will be focusing on-boarding efforts on leading indicator event achievement. If those events are aligned with our unique value proposition, we will amass a customer base that is very sticky to our strategic positioning and very difficult for our competitors to disrupt. The leading indicator example for HubSpot provided earlier is a good example. HubSpot’s strategic positioning was “all-in-one”. Prospects could replicate the HubSpot offering by assembling a number of point solutions to create a broad marketing capability. Using only one feature within HubSpot’s platform was not optimal. There were better point solutions out there. HubSpot’s competitive advantage occurred when customers adopted many features within the HubSpot platform. Therefore, their leading indicator event of “5 or more features adopted” was aligned with their unique value proposition of “all-in-one”.
- Event combinations are OK but keep it simple: As the company expands its product, there may be multiple combinations of events that represent leading indicators of customer retention. These combinations can be “AND” or “OR” definitions. For example, remember Slack’s leading indicator of “2,000 team messages”. Well, 2,000 team messages exchanged between 100 people is likely far more adopted and valuable to the customer than 2,000 team messages between 2 people. Therefore, Slack may evolve their leading indicator to be “2,000 team messages AND 20+ users involved”. They may also find that integration with the CRM represents value and predicted retention. Therefore, they may again evolve the leading indicator to be “(2,000 team messages AND 20+ users involved) OR (2,000 team messages AND integration with CRM)”. As long as the combinations can be evaluated as a binary yes/no, it works. However, keep in mind there comes a cost with this complexity. One of the advantages of the leading indicator is it provides an easy to understand “north star” for the team during the product-market-fit stage. Complex combinations of leading indicators compromises the focus of front line GTM resources.
T is the time by which the leading indicator event is achieved. T should be as short as possible to maximize the pace of learning. However, it needs to be realistic. T often depends on how complicated it is to adopt our product and how long it takes to see value. Dropbox should have a very short T because it takes minutes to download, setup, and see value from the software. Dropbox’s T could arguably be hours. Workday should have a very long T. Workday sells broad, complex HR software into large organizations. It is not uncommon for the setup and user training process to take multiple quarters. Workday could have a T of 6 months or more. On average, T is set between 1 and 3 months for most software companies.
Identify product-market-fit early through customer acquisition cohorts
Once the customer retention leading indicator is defined, we should assemble a cohort chart illustrating the percentage of newly acquired customers that achieve the leading indicator over time. This approach maximizes the speed by which we can evaluate progress toward product-market-fit. Below is an example of a company measuring their leading indicator by monthly customer cohorts.
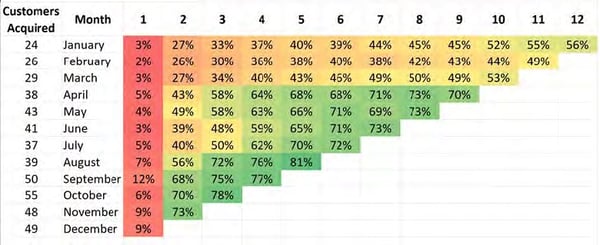
We can bring this chart to life using a fictitious company, TeleMed. TeleMed sells software to doctors enabling them to meet with patients over video rather than in-person. A well-designed customer retention leading indicator could be:
[Customer Success Leading Indicator] is “True” if 70% of customers conduct a video conference with a patient within 2 months.
Therefore, the chart tells us that the company acquired 24 new customers in January. After 1 month, 3% of those 24 customers had actually conducted a video conference with a patient. After 2 months, 27% of those 24 customers conducted a video conference with a patient. After 3 months, 33% of those 24 customers conducted a video conference with a patient. According to TeleMed’s definition of the customer success leading indicator, they had not achieved product-market-fit in the early part of this year. However, the company executed a number of adjustments, likely changes to the product, target customer, sales process, and on-boarding approach, and the situation has greatly improved. In October they acquired 55 new customers. After 1 month, only 6% of those 55 customers conducted a video conference with a patient. However, after 2 months, 70% conducted a video conference with a patient! The execution paid off. This company has achieved product-market-fit. We do not need to wait for long term retention to surface. This company is ready to proceed to the go-to-market stage.
Here are a few guidelines as we design our customer acquisition cohort analysis.
- In order to align all levels of the organization around product-market-fit pursuit, we recommend
this chart be the first slide in the board deck, ahead of the P&L and top line revenue
performance. - The cohorts can be organized by daily, weekly, monthly, or quarterly time periods. Selecting the
appropriate time metric is similar to defining the “T” factor in the customer retention leading indicator discussed earlier. A company like Dropbox should probably use daily customer acquisition cohorts and evaluate the cohorts’ progress toward the leading indicator on a daily basis. Workday should probably use quarterly customer acquisition cohorts and evaluate the cohorts’ progress toward the leading indicator on a quarterly basis. - The “Customers Acquired” column are not cumulative numbers. These figures represent new customers acquired in that month.
- It is possible that the product usage within a cohort declines over time. Customers could dedicate their energy early on to using the product, find that the product is not useful, and stop using it. Companies need to instrument the cohort analysis to capture this behavior shift if it occurs.
- The time (T) of achieving the leading indicator is less important than continued improvement within the cohort over time. In the example above, we could argue transitioning to the go-to-market-fit stage in November even though the pure definition of product-market-fit had not been achieved yet. None of the prior cohorts have achieved 70% within 2 months. However, the prior cohorts were showing continued improvement month-over-month with the expectation that they would reach 70% and continue to rise. Furthermore, looking down the columns, recent cohorts at their 2 month and 3 month anniversary were substantially healthier than past cohorts at the same tenure.
Adjusting the approach for large enterprise deals
The above cohort analysis does not work for early stage ventures selling 6-digit deals or higher to large enterprises. These ventures can surpass $1 million in revenue with less than 10 customers and may only acquire 1 or 2 new customers every quarter. Therefore, an alternative approach to evaluating the pursuit of product-market-fit is necessary.
In these situations, companies assemble a customer health card with a half dozen or so criteria. Common criteria fall into the following categories:
- Status on the technical setup and integration of the product
- Number of users that are activated and active
- Breadth of product usage
- Quantifiable value realization
- Executive sign off on reference-ability
The board literally reviews the “green”, “yellow”, “red” summary status for each company as well as the statuses of each of these criteria, especially for new customers and laggard deployments.
The “Why Now” on Prioritizing Customer Retention ahead of Revenue Growth
Decades ago, prior to broad adoption of the Internet, software was sold, deployed, and used in an “on-premise” manner. This meant companies had to purchase, provision, and maintain their own server networks to run the software purchased for their organizations. The process to set up and train the organization on the software was long and expensive, often taking 12 to 18 months and costing millions and sometimes tens of millions of dollars.
In many cases, the software wasn’t very good. It was hard to use. Adoption rates were low. The term “shelfware” was popularized because most software was never adopted and “sat on the shelf”. Why did this happen? It was because adoption didn’t really matter. Sales did. Once the customer was sold, they were stuck with the purchase for the next 5 to 10 years at least. In this context, the best sales team won.
Fast forward to 2020. The internet has changed two things. First, it no longer takes months to deploy and use software. Cloud, SaaS, and the broader subscription economy have significantly reduced the friction to adopt software. These trends have also reduced the friction to stop using software. Second, every customer has a huge megaphone called social media to tell the market about good and bad product experiences. For both of these reasons, companies are starting to realize the long term health of their business is more dependent on customer retention than customer acquisition. However, the continued premature focus on top line revenue growth is misaligned with these trends. Go-to-market design and execution is, in a way, operating in a by-gone era.
Aligning go-to-market execution with customer retention
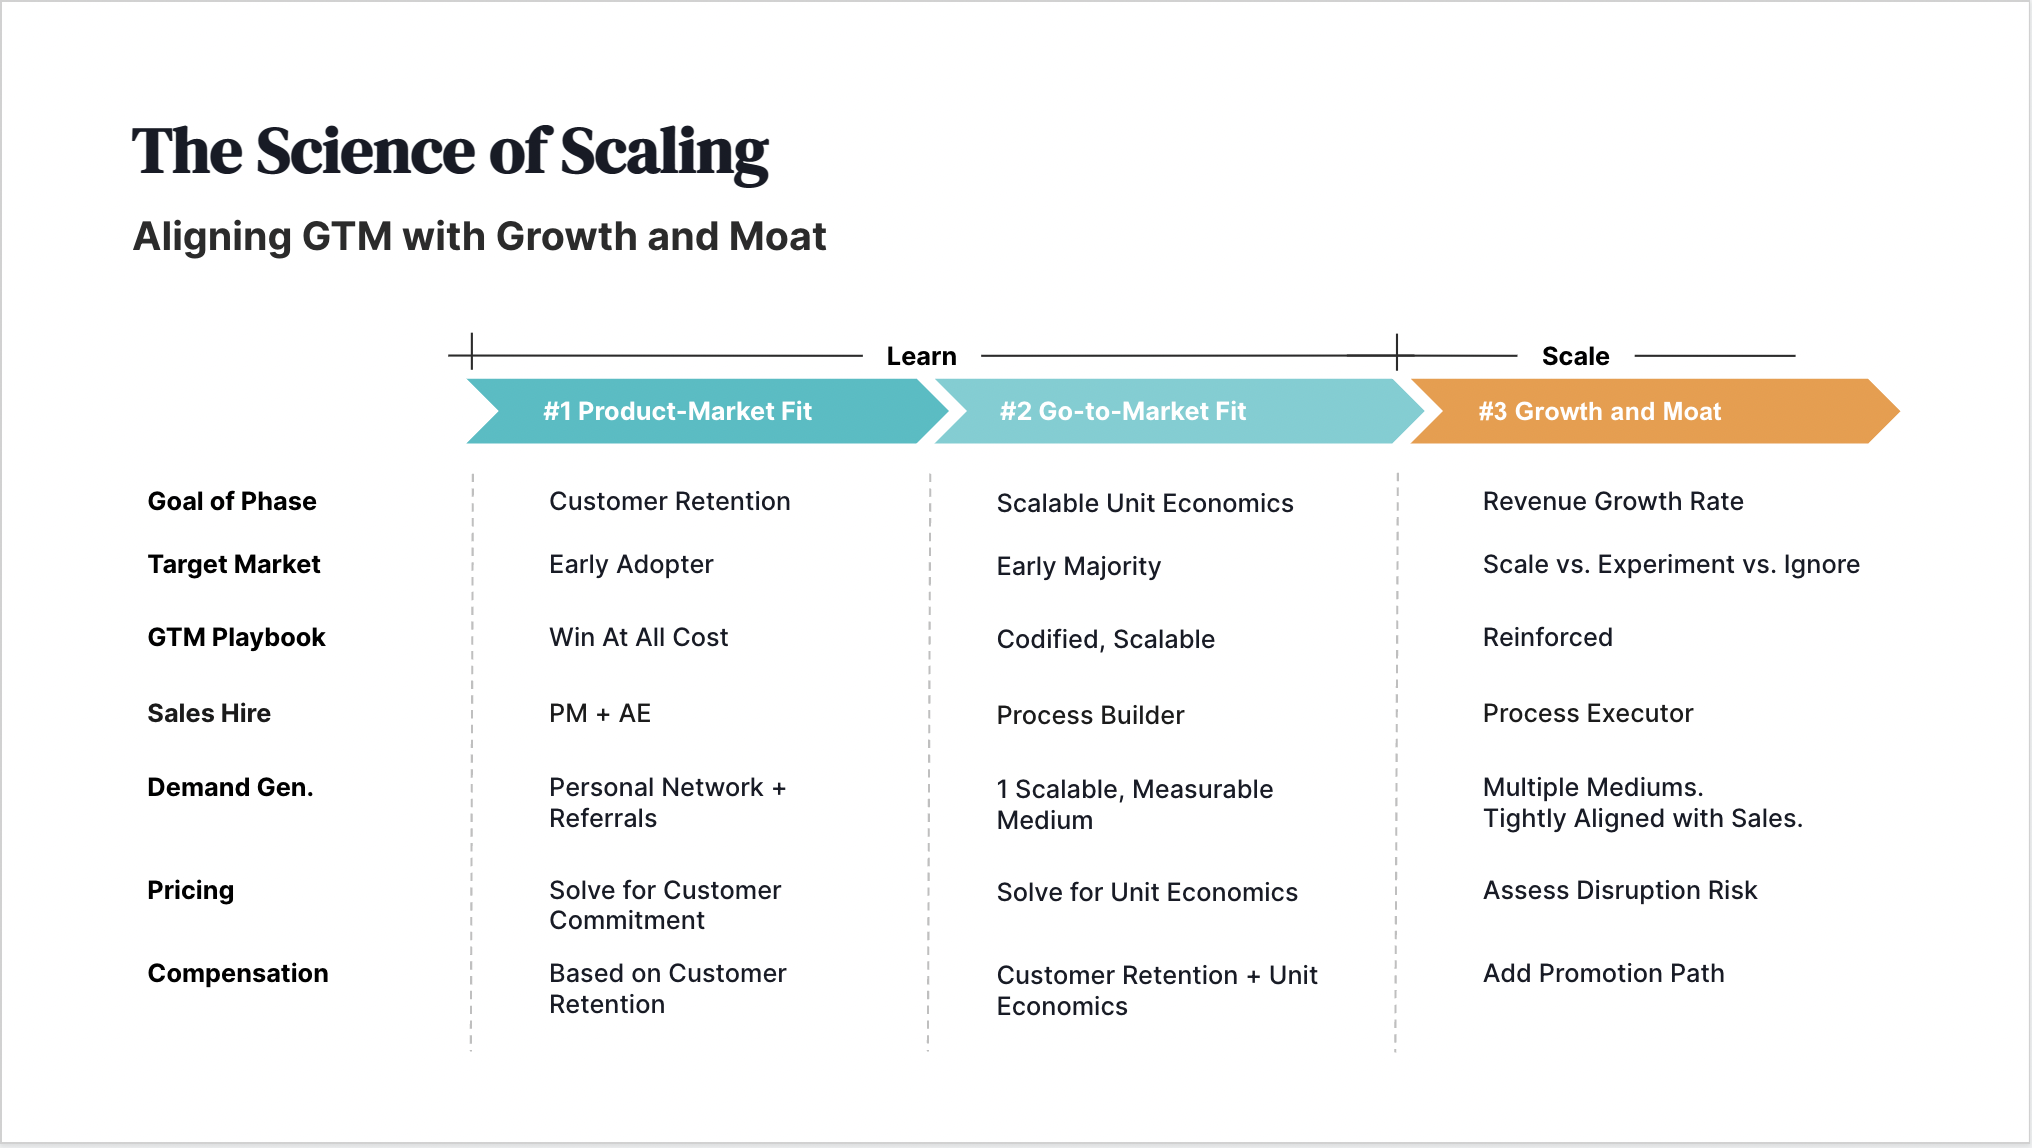
With a more scientific definition of product-market-fit in place, the company has a precise “north star” to focus on. Most companies associate customer retention issues with deficiencies in product or customer on-boarding. However, I find a much different diagnosis. Most customer retention issues originate in sales and marketing. Customer retention is driven by the types of customers targeted by marketing and the expectations set during the sales process. Remember, the odds are against us at this early stage. Only 20% of Series A funded businesses will succeed. Best-in-class companies at this stage align all aspects of the go-to-market with the “north star” of the customer retention leading indicator. The chart below summarizes how.
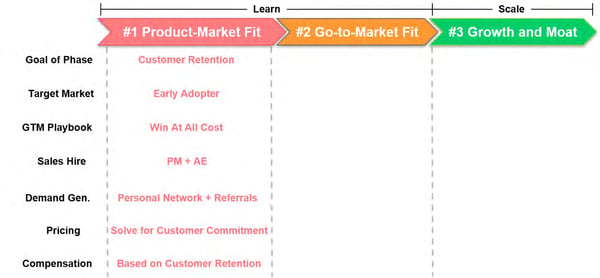
The first three components, target market, GTM playbook, and Sales Hire, are the most critical decisions at the Product-Market Fit stage. The buyers we choose to sell to as well as how we sell and on-board them will be the most important drivers of the customer retention leading indicator. A unique salesperson profile is needed to execute this early playbook. Scalable demand generation, pricing, and sales compensation are not important at this stage. If we are developing scalable cold calling campaigns, launching a tiered pricing model, or designing a robust sales compensation plan at this stage, we are not focused on the right things.
Target Market: Stack the deck with early adopters from smaller companies
Who should we target as our first customers? This question often leads to a debate between large customers that yield powerful reference-ability versus small customers that enable rapid learning. On one hand, we should pursue a “big-brand” customer. If we can acquire and make the customer successful, it sends a powerful signal to the market that if this new product was good enough for the big brand, it must be good enough for everyone else. On the other hand, we should pursue the smallest customers within their target market. Small customers are easier to connect with, make decisions faster, and have simpler product adoption requirements than larger companies. Therefore, pursuing smaller organizations provides the fastest path to learning.
As entrepreneurs, we pursue the “big-brand” customer most often. However, the choice is not optimal. We under-estimate the difficulty of setting a meeting, the high bar of IT and security requirements, and the “red tape” interfering with product adoption even after purchase. We should err toward the smaller customers to foster rapid learning. We should reflect on how small we can go within our target market definition where our product still creates value and start there.
The other consideration is the optimal person within the target customer. We need “early adopters” not “laggard followers”. We are still learning and refining our product and business. We need early customers who are excited to innovate with us. Often, an “early adopter” is more about the individual buyer within the organization than the organization itself. These buyers view themselves as first movers. They enjoy playing with new products and don’t mind that there are bugs. They are excited to send us lots of feedback and ideas. They enjoy being part of the innovation process. Early adopters care less about customer references or robust ROI studies. Save case study and ROI driven customers for the scale up stage. We are not ready for them.
Go-to-Market Playbook: Win at all cost
There are two themes for the GTM playbook at this stage, “win” and “do things that don’t scale”. “Win” is the customer retention leading indicator, not a signed contract or payment.
“Do things that don’t scale” is advice from Y Combinator founder, Paul Graham, and should be kept at the forefront of our minds at this stage. I remember chatting with David Cancel, CEO of Drift, at this stage of his business. He was literally flying out to have one-on-one on-boarding meetings with customers that were paying him $50 per month, as the CEO! “Do things that don’t scale”. Throw everything and the kitchen sink at achieving our early indicator of customer retention. One-on-one, “white glove” on-boarding processes, even for low value customers, are good. Mass on-boarding sequences are not optimal at this stage.
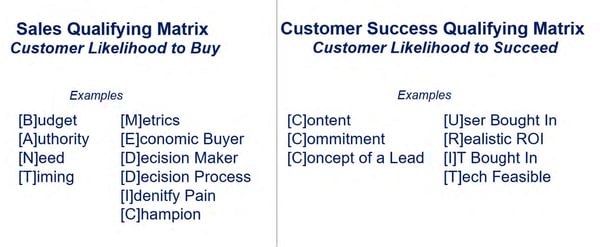
The one component of the long-term GTM playbook worth codifying at this stage is the Customer Retention Qualifying Matrix. Qualifying matrices like BANT and MEDDIC are commonly used in sales to understand the likelihood that a customer will buy. However, they do not help us understand whether the customer will succeed with the product and ultimately remain as a customer. Common components of the Customer Retention Qualifying Matrix include whether IT is aware of implementation tasks, the end user(s) are part of the purchasing process, not just the decision maker(s), the customer’s tech stack is compatible with the product, etc. As a seller, we can get a signed contract without having these items in place. In fact, accomplishing these tasks may actually slow the deal down. However, not completing these tasks before the purchase will likely put successful product adoption at risk. We are solving for customer retention, not signed contracts.
Sales and Customer Retention Qualifying Matrices
Sales Hire: Half Product Manager, Half Account Executive
Getting this hire wrong is a top 10 reason for Series A funded business failure. The first pothole most organizations fall into is pre-maturely hiring a sales leader. I can hear the Series A investor now: “Go find someone that has scaled a business to $100 million”. The hire is a complete mis-alignment for the tasks required at this stage. The second pothole is hiring an account executive from the large incumbent in our space. Yes, this account executive is successful selling to our buyer however, when they joined the incumbent, they went through weeks of sales training, were provided a sales playbook, and were scaffolded with an experienced sales manager. This “process execution” salesperson will not succeed in our environment where these assets and infrastructure do not exist.
At this stage, look for a mix between an account executive and a product manager. The first sales hire should have the skills to handle objections and comfort discussing money like an account executive. However, they should also have the ability to pattern recognize feedback from the target market and communicate the patterns to engineers. Focus on these attributes when evaluating candidates:
- Comfortable in ambiguous, rapidly changing environments. Self starter.
- Motivated more by innovating than making money. Avoid the salesperson primarily motivated
by money at this stage. - Ability to dive into customer needs through deep discovery skills and identify patterns
- Strong collaboration skills to work in cross-functional teams, primarily with product and engineering
Demand Generation: Rely on personal network and referrals
“Do things that don’t scale.” We do not need 1,000 customers to achieve product-market-fit. We have a lot to do and adding the development of a scalable demand generation capability, such as an SDR cold calling team or a content marketing function, is mis-aligned with our phase of development. Rely on personal networks of founders, employees, and investors as well as customer referrals. These channels do not scale. However, they yield the highest quality opportunities to learn from.
Pricing: Minimize friction, maximize customer commitment
“Do things that don’t scale.” Our goal at this stage is maximum learning, not profits. Unless the biggest uncertainty in our business model is the product price, which is rarely the case, don’t spend a lot of time optimizing the price at this stage. Keep the price as low as possible to reduce friction. However, “free” is not effective as the customer will not be committed. Charge enough so the customer is committed to achieving product adoption and success. Be explicit with customers that our business model calls for a price of say $30,000 per year but we plan to sign up the first 20 customers at a 90% discount. Don’t be afraid to “grandfather” these customers into these discounts for some time. This approach will naturally attract the early adopters we need at this stage. We don’t need to raise a bunch of venture capital to afford to do this. The cost is the long hours of our small team, not an army of staff. This approach is simply a continuation of the market research and lean startup phases we have recently executed.
Sales Compensation: Simple and aligned with the customer retention leading indicator
If we hire the right salesperson profile at this stage, the design of the sales compensation plan will have minimal impact on this phase. We may even consider no sales compensation plan, using a base salary and equity just like everyone else on the team. There is no reason why the salespeople should be the only employees who suffer financially if it takes longer than expected to navigate through the product-market fit stage. Furthermore, a traditional sales compensation plan designed around new revenue acquisition mis-aligns the salesperson from the company objective of rapid learning and customer value creation.
If we did use a sales compensation plan at this stage, avoid making it too leveraged. Consider 80% base salary and 20% variable compensation. Also, align the compensation with the leading indicator of customer retention. Pay when the leading indicator is achieved, not when the contract is signed or the payment is made. Remember, the “win” here is the achievement of the customer retention leading indicator.
Verify the leading indicator of customer retention
As the company and customer base develops, we need to verify whether the leading indicator actually correlates with customer retention. In most cases, companies have moved on to the next phases before it is possible to verify this correlation. That is fine. However, it is important to conduct the analysis and continually conduct it in order to understand that the foundation is strong.
Below is an example verification for TeleMed, our fictitious doctor video company. As a reminder, TeleMed used:
[Customer Success Leading Indicator] is “True” if 70% of customers conduct a video conference with a patient within 2 months.
Correlate leading indicator of customer retention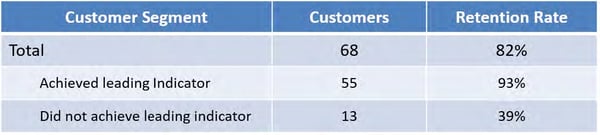 Analysis of customers (churned and active) acquired between 12 and 18 months ago
In the above example, the company had acquired 68 customers between 12 and 18 months ago. Of the 68 customers, 56 are still customers for an overall retention rate of 82%. Of the 68 customers, 55 had achieved the customer retention leading indicator. In other words, 55 of the 68 customers conducted a video conference with a patient within the first 2 months. Of those 55 customers, 51 are still customers for a retention rate of 93%. Similarly, 13 of the 68 customers did not achieve the customer retention leading indicator. In other words, 13 of the 68 customers did not conduct a video conference with a patient within the first 2 months. Of those 13 customers, 5 are still customers for a retention rate of 39%. In this case, the leading indicator seems to predict long term retention well.
Correlate leading indicator of customer retention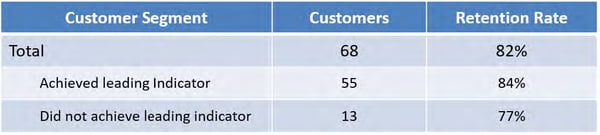 Analysis of customers (churned and active) acquired between 12 and 18 months ago
The above example is similar to the prior one. The company had acquired 68 customers between 12 and 18 months ago. The overall retention rate was 82%. Of the 68 customers, 55 had achieved the customer retention leading indicator and 13 did not. However, in this case, only 84% of the customers that achieved the leading indicator are still customers and 77% of the customers that did not achieve the indicator are still customers. The leading indicator does not seem to predict long term retention well.
Recommendations for the verification analysis include:
- Limit the analysis to customers acquired between 12 and 18 months ago. Customers acquired
before 12 months may have not had an opportunity to churn, especially if annual contracts are in place. Customers acquired more than 18 months ago are less representative of the current
state of the go-to-market operations. - Conduct the analysis quarterly, as the correlation may change as the market and product evolves.
- The verification analysis is not a prerequisite to moving to the go-to-market fit stage. Use the leading indicator to determine stage graduation.
- If we have historical customer data, analyze the correlation between our leading indicator hypothesis and long term retention now.
- Don’t worry if we didn't get the indicator correct. Focusing on these events, like setup or usage, probably didn’t hurt the business. Run other theories to see what events are actually correlating better and re-align the business with these events.
What We Learned
- We use “product-market-fit” to make critical decisions such as when to scale. However, we lack a scientific, data-driven definition of the term, creating timing mistakes on our decision to scale.
- Customer retention is the best statistical representation of product-market-fit. However, customer retention is a lagging indicator. We need to define the customer retention leading indicator.
- Assuming long term customer retention is the best statistical representation of product-market-fit then:
- Organizing our customers into acquisition cohorts and measuring their progress toward the customer retention early indicator enables early identification of product-market-fit.
Phase 2: Go-to-Market Fit
Section Summary
- Go-to-market-fit is acquiring and retaining customers consistently and scalably.
- Strong unit economics is the best measure of scalability and, in turn, go-to-market fit. However, like customer retention, unit economics are lagging indicators.
- Therefore, we need to extract the long term unit economics target into short term go-to-market activity goals
In the product-market fit phase, we demonstrated that we could acquire and retain customers consistently. Go-to-market fit means we can acquire and retain customers consistently and scalably. Part of scalability is ensuring we have a large enough target market to support our growth aspirations. The other part is, as we pursue that growth, we can do so in a profitable manner. In an early stage environment, it is advisable to measure profitability using unit economics rather than operating margin or EBITDA. Some of our costs increase with scale, which we often refer to as variable costs, while other costs remain relatively stable with scale, often called fixed costs. Unit economics allow us to extract out the fixed costs so we can more closely analyze how financially sustainable scale is for our business. Therefore, the quantifiable goal of the go-to-market fit phase is to prove the company’s ability to acquire and retain customers with strong unit economics.
The software industry currently rallies around three unit economic goals.
- LTV/CAC > 3
- Payback period < 12 months
- Magic Number > 1.0
These metrics provide a scientific, data-driven definition of go-to-market fit. However, we have the same issue that we encountered with customer retention in the product-market fit stage. Unit economics are lagging indicators. Like customer retention, it may take a year or more to assemble enough historical data to accurately calculate our company’s unit economics. Therefore, we need to understand the leading indicators of unit economics. We need to extract the long term unit economics target into short term go-to-market activity goals.
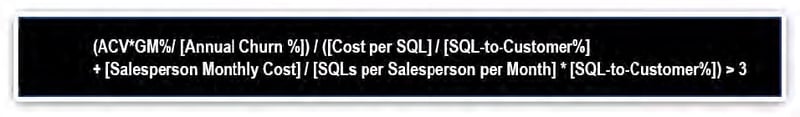
Below is an example of this approach using the LTV/CAC unit economics metric:
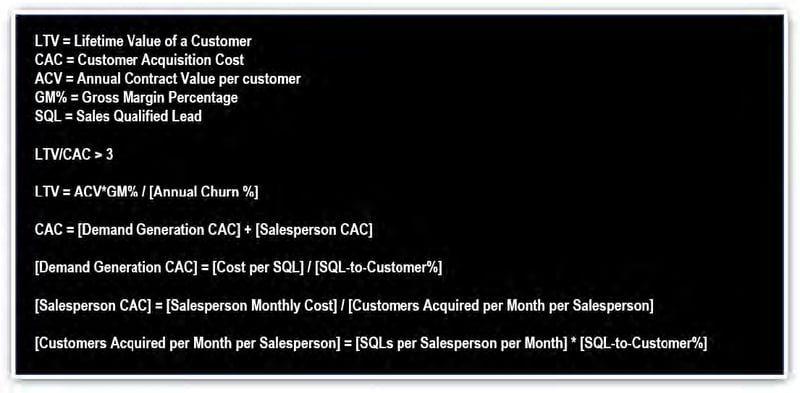
Through fairly simple algebra, we can express the long term goal of:
- LTV/CAC > 3
...using near term activities: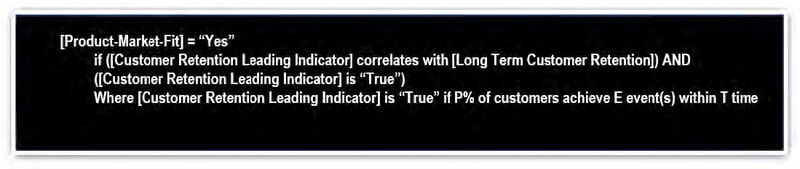
For example, a company may have the following assumptions and results:
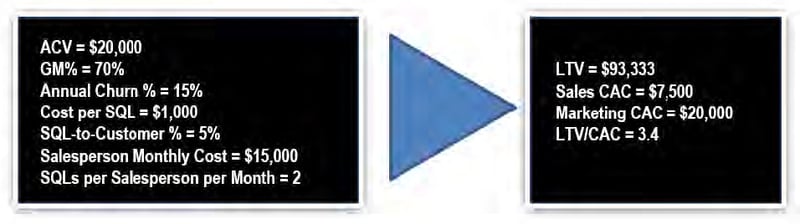
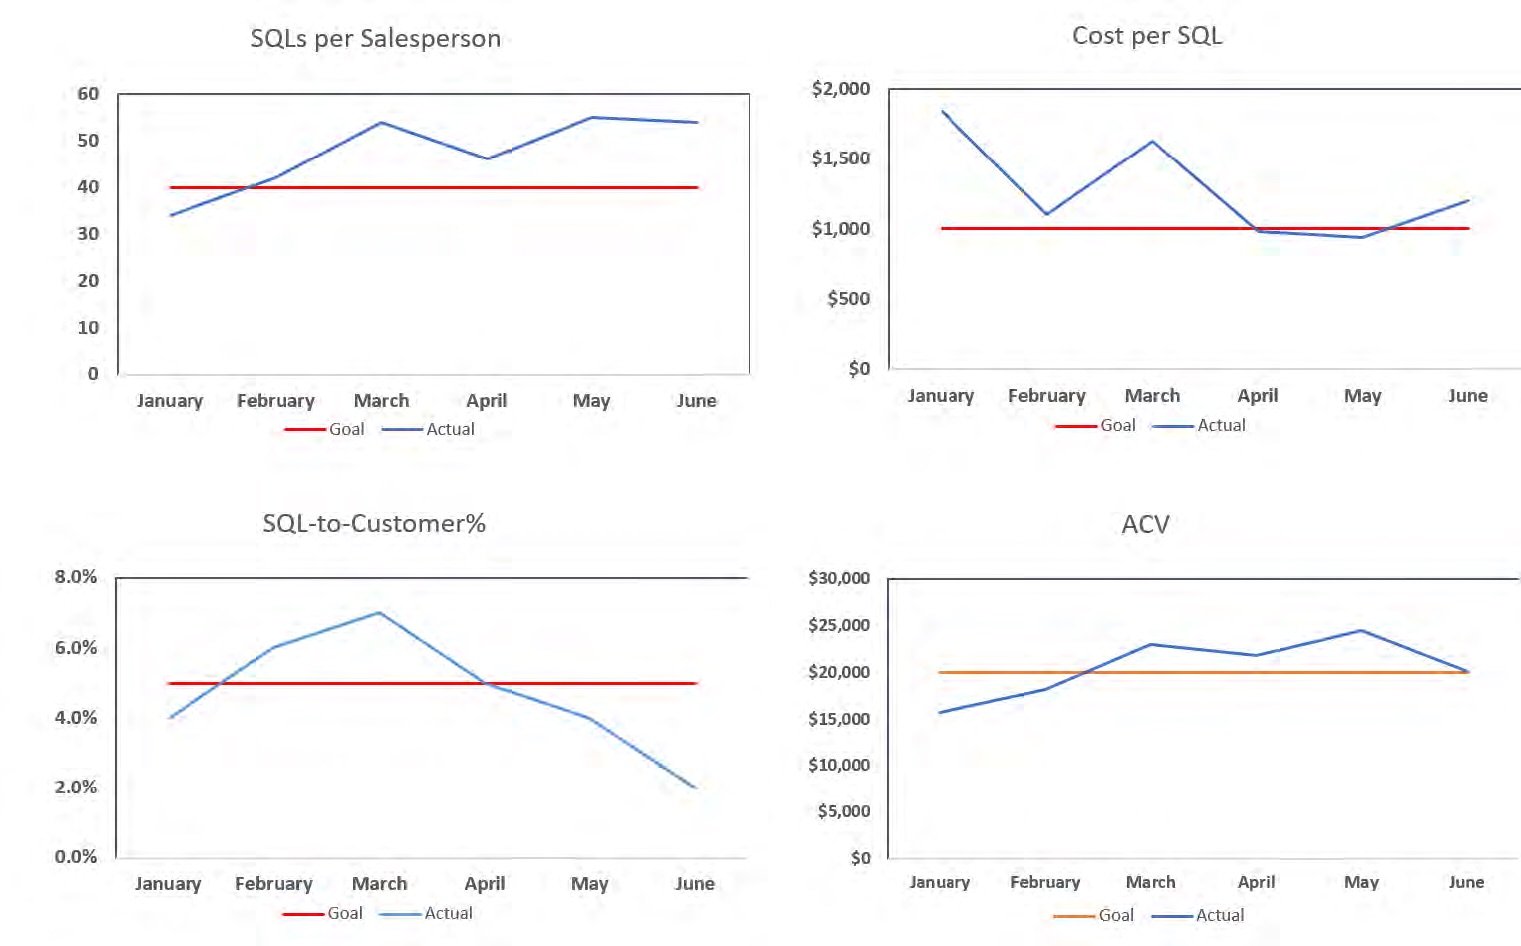
Similar to the leading indicator cohort analysis, we can now instrument the leading indicators into daily, weekly, or monthly activity charts to evaluate our progress toward go-to-market fit.
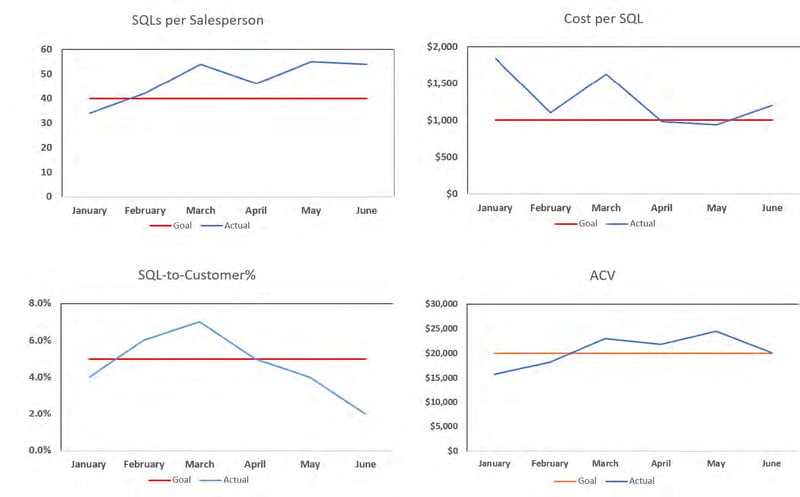
The dashboard above provides monthly, and potentially weekly, updates on how we are tracking against long term unit economics. We are in good shape if the blue line stays above the red line. A few considerations are as follows:
- The go-to-market fit formula had seven inputs. However, only four metrics are tracked in the above dashboard. Gross margin, customer retention, and cost per salesperson are not included. Customer retention is tracked using the customer cohort analysis designed in the product-market-fit phase. Cost per salesperson is relatively predictable and doesn’t need to be tracked. Gross margin is the more complicated metric. In many business models, acquiring customers profitably (CAC) has more uncertainty than on-boarding and servicing them (gross margin). This assumption is not always the case. However, it is typically the case. I would be far more optimistic about a company with strong customer acquisition metrics and mediocre gross margin than vice versa. Mediocre gross margin is often fixable with scale. Therefore, I recommend assuming around 70%, tracking it, and moving to the Growth and Moat stage even if gross margin is suboptimal.
- When estimating the salesperson monthly cost, include a buffer for sales management and to offset the added cost of ramping salespeople. Adding 25% to the direct cost of our salesperson is a good buffer.
- This analysis does not account for sales cycle and salesperson ramp time. These effects will have an impact on scalability and can be modeled during the growth stage to estimate the impact on cash flow.
- Notice the SQL-to-Customer% drop from April to June. This drop is common as the SQLs created in June have not gone through the necessary sales cycle yet. As those SQLs are closed in the months to come, the metric will improve. When assessing all of these metrics, the results from a few months ago are better estimates of the long term assumption than recent data points.
Align go-to-market execution with leading indicators of scalable unit economics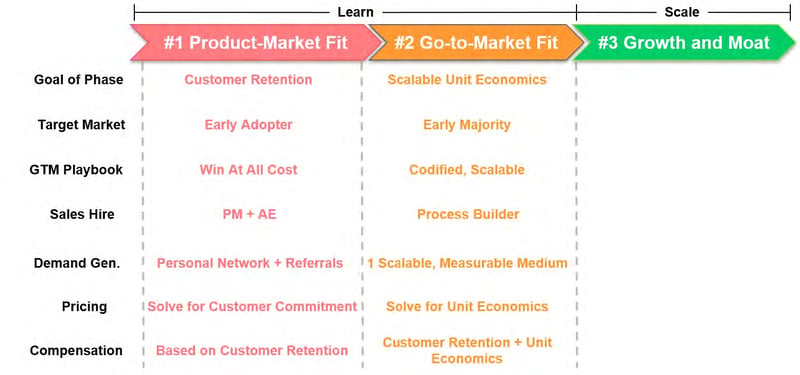
With a scientific, data-driven definition of go-to-market fit, we can now evolve our GTM decisions to align with this new “north star” for the organization. In summary, we need to evolve each component of the GTM strategy to achieve scalable unit economics while preserving customer retention.
Target Market: Expand to the Early Majority
During the product-market-fit phase, we targeted early adopters to facilitate rapid learning. However, early adopter segments are rarely large enough to accommodate the next few years of growth aspirations. Furthermore, it is often difficult to develop scalable demand generation capabilities that reach early adopter segments. Therefore, we need to expand our target market to early majority segments.
If we are aspiring to build a unicorn business with a billion dollar market valuation, we need to be targeting a large market. However, as we accelerate toward our first scale cycle, use a “design big, start small” approach. Yes, have a vision toward a robust product offering targeting a broad, extensive market. However, we do not need to “boil the ocean” in the first few years of scale. Later in the eBook, we will discuss scientific approaches toward uncovering future growth opportunities. At this stage, let’s identify select segments within our overall target market with which we have the highest likelihood of success. Remember, our goal is consistent customer retention with strong unit economics so keep both of these factors in mind when selecting the target segments. These segments should be large enough individually to support the next few years of growth. For most high growth software organizations, this means supporting a $50 million revenue business, assuming 5% to 10% market share, over the next few years. Starting with two or three of these segments is sufficient.
GTM Playbook: Codified, Scalable
During the product-market-fit phase, we executed a “win at all cost” GTM playbook. During the go-to-market fit phase, we need to prove we can win scalably while maintaining customer retention. Essentially, we need to codify a go-to-market playbook defining how the GTM team interacts with buyers from their initial awareness through purchase and successful onboarding. In the Growth and Moat phase, we will leverage the playbook as the foundation for our new hire training and sales coaching model. It is critical we prove the playbook yields scalable unit economics before aggressively hiring salespeople.
As entrepreneurs, we make an enormous mistake when designing our initial GTM playbooks. We often start by creating a PowerPoint deck that describes the features and benefits of our product and train our sellers to deliver the presentation to as many people as possible. This mistake is a top 10 cause of Series A business failure. The study below conducted by Gong.io helps us understand why.
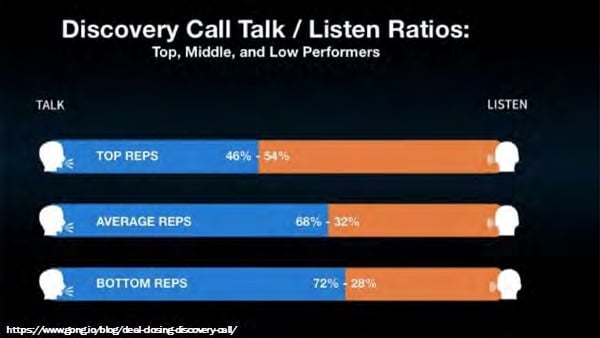
The study shows top performing sellers listen most of the time on the first call. Bottom performers speak most of the time. This fact has been known anecdotally in sales for decades and is nicely illustrated statistically here by Gong. Why? Because world class selling is about buying. It is first and foremost about understanding the buyer’s perspective, assessing if we can help them, and, if so,
The Science of Scaling
20
tailoring our presentation to the buyer’s context. That is what top sellers do. In a world where buyers have exponentially more data at their fingertips and are less dependent on human sellers to make buying decisions, the performance variation between these top sellers and the bottom segment will widen.
Unfortunately, we often fail to design their GTM playbook to align with this best practice. Let’s reflect on our current sales training program or the one we aspire to implement. How much is focused on teaching our salespeople about our product versus our buyer? We are typically focused on the former not the latter. We are wiring our sellers to act like the bottom performers rather than the top performers.
I label this flawed approach to GTM playbook design as “inside-out”, or starting with the product. Instead, we need to take an “outside-in” approach by starting with our buyer.
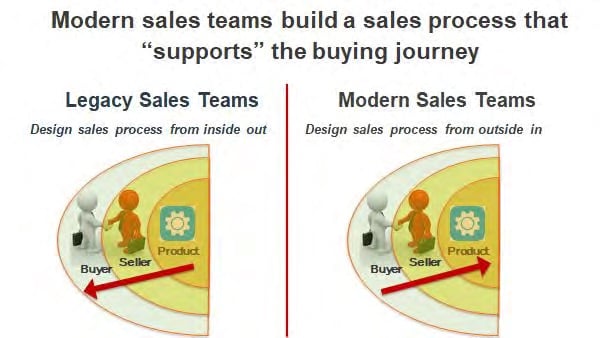
This approach yields a GTM Playbook that supports the buyer through their journey. The illustration below illustrates a GTM playbook framework that positions the buying journey as the foundation for all other components.
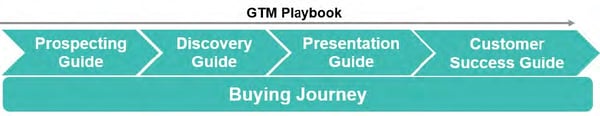
The framework identifies five components of the GTM playbook.
- Buyer Journey
- Prospecting Guide
- Discovery Guide
- Presentation Guide
- Customer Success Guide
GTM Playbook Component #1: Buyer Journey
The Buyer Journey illustrates the steps the buyer proceeds through as they frame their challenges and goals, identifies solution categories to consider, decides and purchases the offering optimal for their objectives, and integrates the offering into their business to enable the intended value. The framework below summarizes these steps.
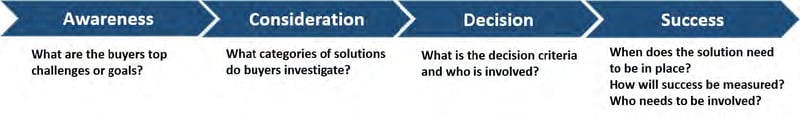
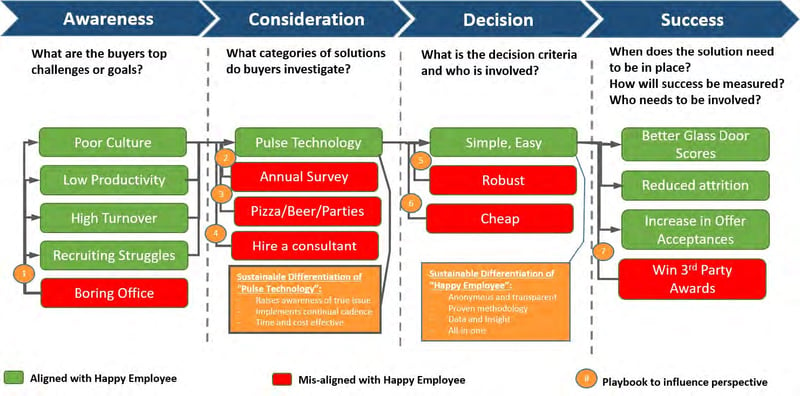
When designing the buyer journey, we should view the exercise through the lens of a buyer who doesn’t even know our product exists yet. Below is an example buyer journey. This example is the buyer journey for a software company that helps businesses monitor their employee morale through a simple, weekly survey asking employees to rate their current happiness. We will call the company “Happy Employee Inc.”
The buyer journey framework establishes the foundation for the GTM Playbook to support.
GTM Playbook Component #2: Prospecting Guide
The prospecting guide codifies the salesperson’s approach to establishing a first meeting with the buyer. Prospecting approaches vary depending on GTM context. Salespeople targeting large organizations with complex solutions often use an Account Based Selling (ABS) approach that may involve in-person events, highly customized prospecting emails, and a heavy investment in leveraging introductions through existing company networks. On the other end of the spectrum, companies selling more transactional solutions to SMBs may rely on a cold calling SDR capability or calling on inbound leads generated through a content marketing campaign.
There are three common mistakes in the prospecting guide design. The first common mistake is using a message and call-to-action mis-aligned with the buyer journey. Most prospecting from startups focuses on the product value proposition and asks the buyer if they would like to book a product demo. However, as we established in the buyer journey design, the majority of buyers we engage with at the prospecting stage are at the awareness stage. A message about our product and offer for a demo is aligned with the decision stage. We need a message and call-to-action aligned with the awareness stage. For Happy Employee Inc., we could send buyers a study on the best practices similar companies are using to drive employee morale and offer a free consultation to benchmark their current organization against these best-in-class peers. This prospecting approach is far more aligned with buyers awareness stage.
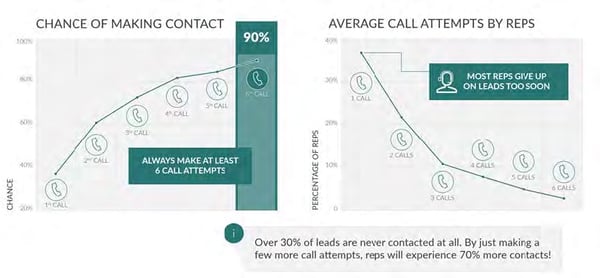
The second prospecting mistake is not being persistent enough. The study below from InsideSales.com shows that making only one attempt against a buyer yields a first meeting 40% of the time. Making 6+ attempts yields a first meeting 90% of the time. Persistence pays off. However, the study continues and shows most sellers only make one or two attempts. Simply devising a 6+ attempt prospecting sequence can double the number of first meetings.
The third common prospecting mistake is repeating the same message through the same medium across all 6 attempts. Sellers should envision their prospecting efforts as a continuous dialogue with a buyer across multiple mediums. If we had 1 minute every day to speak with our buyer, we wouldn’t tell them the same thing every time. We would facilitate a story-line of information based on the assumptions we have on their needs. Even though the buyer is not responding, they are likely listening.
GTM Playbook Component #3: Discovery Guide
The Gong study shown earlier illustrated that top salespeople listen most of the time in the first meeting and bottom performers talk the most. Our playbook needs to codify how our sellers should go about questioning and understanding the buyer’s perspectives in the first meeting, often referred to as “discovery”. In a way, the discovery guide instructs our sellers how to determine where the buyer is on the buying journey model. The guide is not a script of questions that should be asked sequentially. Instead, it is a simple one-page document organized by the buyer journey stages with suggested questions or techniques that can be used at each stage.
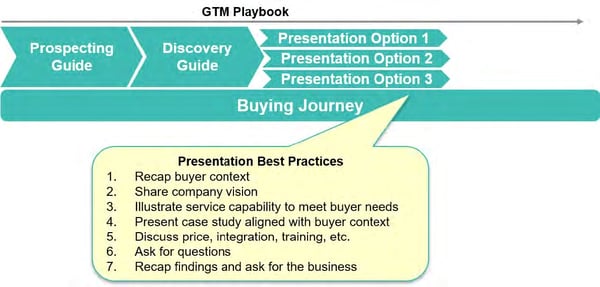
GTM Playbook Component #4: Presentation Guide
Once our salespeople understand where the buyer is on the buying journey, they can assess whether we can help the buyer and, if so, tailor the presentation of the product to the buyer’s perspective. The biggest mistake sellers make at this stage is failing to leverage the information gathered about the buyer’s context as they explain their offering. Instead, sellers move into auto-pilot, showing the same product features in the same order using the same language for every buyer. World class sellers never give the same demo. They tailor the messaging, nomenclature, and feature emphasis to the buyer. One very important clarification, great salespeople do not lie. They simply help the buyer connect their unique needs to the aspects of the product that are most applicable. This sales approach is critical toward the pursuit of world class customer retention and unit economics. The approach also clearly establishes the value of the sales team beyond the generic information available on the company website.
Unfortunately, few professional sellers can pull off this goal, especially in the first few months on the job. Our presentation guide needs to help mere mortal sellers to do this. Therefore, as an effective form of “training wheels”, we can create 3 to 5 different presentation “swim lanes” that can be used depending on our findings in the discovery stage. Therefore, we have simplified the presentation approach from a complicated “tailor the pitch to every buyer” to “ run the discovery process and then choose the best presentation approach from these 3 options”.
GTM Playbook Component #5: Customer Success Guide
The customer success guide codifies the post sales process, applying the learnings from the product-market-fit phase. In the product-market-fit phase, we created consistent customer success using a “win at all cost” approach. Now we need to replicate these results using a scalable process. For companies acquiring large customers with complex offerings, this process may involve multiple meetings on site to assist IT and security with product setup and change management personnel with complex user training strategies. For simpler solutions selling to SMBs, the guide may leverage a combination of virtual one-on-one meetings combined with group training and video based tutorials.
Similar to the presentation phase, the most common mistake we make with the customer success guide is unnecessarily standardizing the on-boarding process into a one-size-fits-all model, ignoring the unique contexts uncovered during the sales process. There is no bigger turn off to a buyer that experienced a highly customized sales process than a generic on-boarding process. In order to balance scale with this need to tailor, we can leverage a similar strategy to the presentation stage by defining 3 to 5 swimlanes to align with the unique context of the buyer. Often these swimlanes correspond to the swimlanes used in the presentation guide.
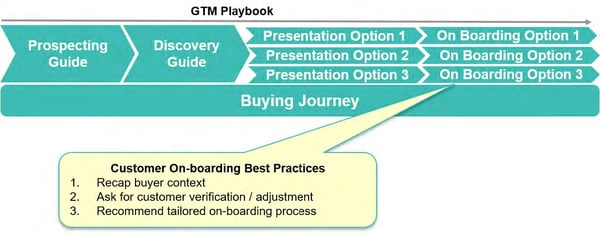
To facilitate the transition, our customer success manager begins the on-boarding process with a summary of the findings from the sales process, such as the specific goals the customer wants to achieve. Once the customer verifies the information, the customer success manager then presents the recommended on-boarding process, rooted in the goals of the customer. For larger ticket items, our salesperson should also attend the meeting to introduce the customer success manager and listen to the resulting dialogue, intervening where necessary to clarify any points as the relationship develops.
Sales Hire: Process Builder
In the product-market-fit phase, our first sales hire was half product manager, half account executive. The hire was tasked with balancing the skills required to acquire initial cohorts of customers through a “win at all cost” approach with the ability to summarize market feedback and effectively communicate the insights to product and engineering resources. As we transition to the go-to-market-fit phase, we need salespeople that can codify the GTM playbook. They are process, rather than product, innovators. They thrive on rapidly changing environments and enjoy the process of establishing playbook hypotheses, testing the processes against buyer conversations, and iterating based on test observations.
“Film reviews” play a crucial role in this process. Film reviews bring together the team to discuss the effectiveness of the GTM playbook in actual buyer discussions. If local laws allow it, film reviews are best conducted using recorded sales calls. Below are a few specific tips on running effective film reviews:
- Assign one seller to be on the “hot seat” for each session. This person is responsible for recording a prospect call for the film review. Obviously, abide by your local privacy laws when doing so.
- Start with discovery calls. These calls are most effective in understanding the current voice of the customer.
- At the beginning of the meeting, assign one observer to think about positive feedback and one person to think about needs for improvement. A total of 5 to 10 people in the room is optimal.
- Listen to the call together. Once complete, have the person on the “hot seat” reflect first. Then have the “positive feedback” person share their comments. Then have the “needs for improvement” person share their comments. Then open it up for general comments from the group. As the leader, close the meeting with a summary of take-aways, hopefully generated organically by the team. Frame takeaways and feedback less about specific criticisms on the “hot seat” salesperson and more on general improvements the team should strive for.
- Don’t hesitate to include representation from marketing, product, and customer success. Again, these calls are remarkable opportunities to continually understand the voice of the customer and embed a renewed view into their daily work.
At this stage, conduct film reviews with the entire GTM team, the founder, and representation from the product team. Film review frequency quantifies and drives the pace of learning and codification and, given that this item is one of the critical paths of scale at this stage, these reviews should be conducted daily.
Demand Generation: One Scalable, Measureable Medium
During the product-market-fit phase, we did not understand our target market and optimal messaging well enough to justify the codification of a scalable demand generation channel. However, having graduated from this phase, the development of at least one scalable demand generation channel is a prerequisite to rapid scale. Hiring sales people without a scalable demand generation channel in place is another top 10 reason for Series A startup failure. Common demand generation channels at this stage include cold calling through an SDR program, content marketing, paid digital marketing, Account Based Selling through a senior sales team, buyer networking events, etc. Most companies have dozens of potential channels to generate demand. Founders should brainstorm a comprehensive list of options with their team and then reflect on the 2 or 3 that are most likely to succeed. Considerations for this selection process include:
- Alignment with target buyer behavior. Cold calls are more likely to work for salespeople. Content marketing is more likely to work for technical buyers.
- Channel measurement. We need to be confident the channel yields scalable unit economics. Quantifying success of paid ad campaigns is easier than billboards and even events.
- Rapid test potential. S eek out tests that yield results in the shortest amount of time and least amount of money. Both resources are scarce at this stage of the venture.
- Aligned with Customer Success. One of the biggest mistakes in demand channel measurement is basing success on the sale versus the customer success. We would rather attract buyers who have high LTV, even if selling them is more difficult, than buyers who are easy to convert to customers but don’t succeed with our product. Base marketing channel success on LTV not lead conversion rate.
Pricing: The intersection of customer ROI, scalable unit economics, and competition
During the product-market-fit phase, we de-emphasized work on price optimization, instead pricing enough to ensure commitment from the buyer to pursue success with our product. At the go-to-market-fit phase, price optimization is an enormous lever to achieve our scalable unit economics goal. However, sophisticated techniques used by mature organizations, such as conjoint analysis, are rarely feasible in early stage environments. That said, licking our fingers and putting them in the air seems insufficient for such a critical decision.
Instead, we analyze early stage pricing decisions through three lenses. The first lens is the ROI created for our buyer. We should quantify the ROI the buyer will receive from our product and target a price range that is roughly 30% to 40% of that value. The second lens is our business model. At the beginning of this section, we extrapolated long term unit economics back to short term GTM outcomes, one of which was ACV. Price and ACV are highly correlated. This analysis gives us a sense of the required price range to achieve scalable unit economics. The third lens is an assessment of our competition and broader substitutes. What other products and services are available to buyers to accomplish similar goals? How much do they cost? We don’t necessarily want to win on a lower price. In most cases, we want to win on value and justify a higher price. We simply need to run this analysis from the viewpoint of the buyer to ensure our added value justifies our higher price.
Sales Compensation: Preserve customer retention, achieve scalable unit economics
Similar to our approach to pricing during the product-market-fit phase, we also de-emphasized optimization work on sales compensation. However, sales compensation is a critical driver of CAC and, in turn, scalable unit economics. Therefore, optimization is imperative during the go-to-market phase. Sales compensation design involves the total pay for salespeople, the percentage that is base salary versus variable, and the rules by which the variable portion is paid out. The latter is the most complex component.
The biggest mistake founders make with sales compensation design at any stage of a business is delegating the design to the head of sales, who simply copies the plan from their last employer. Founders under-appreciate how powerful of a tool the sales compensation is to align their front line resources with their C-level strategic priorities. Founder-level strategies such as market expansion, churn reduction, and new product introductions can all be implemented through well-designed sales compensation plans.
Our high level strategy at the go-to-market-fit stage is the achievement of scalable unit economics while preserving consistent customer retention. A common mistake we make is putting too much or all emphasis on revenue acquisition, such as setting a new revenue quota and paying salespeople on it. This plan design fails to motivate salespeople to preserve quality customer acquisition by pursuing the right customer segments and setting the right expectations to maximize product success. A better design is to pay 50% of the commission when the buyer purchases the product and the other 50% when the buyer achieves the leading indicator of customer retention.
What We Learned
- Go-to-market-fit is acquiring and retaining customers consistently and scalably.
- Strong unit economics is the best measure of scalability and, in turn, go-to-market fit. However, like customer retention, unit economics are lagging indicators.
- Therefore,we need to extract the long term unit economics target into short term go-to-market activity goals
Phase 3: Growth and Moat
Section Summary
- We are ready to scale when we have product-market-fit and go-to-market fit
- Scale is a pace, not a single lump sum event
- We should scale as fast as possible without losing product-market and go-to-market fit.
- Use the speedometer to determine the moment we lose product-market or go-to-market-fit
Congratulations. We are ready to scale.
At the beginning of this eBook we pondered why two critical questions, “when to scale?” and “how fast?” are not approached with more science and data. We have since established a more rigorous framework for the first question, “when to scale?”.
In summary:
- We are ready to scale when we have product-market-fit and go-to-market fit
- We have product-market-fit when P% of customers achieve E event(s) within T days
- We have go-to-market fit when:
But what about the second question, “how fast”?
Our approach to initial scale is another common cause of Series A failure. All too often, once we decide it is time to scale, we hire a number of salespeople all at once. Usually this behavior occurs at the start of a fiscal year or right after a funding round. Pretty much every company I looked at over the past few years took this approach to scale at some point. I never really saw it work. I am sure successes are out there. I just haven’t seen it. Most of the time, these companies hired 10 salespeople in January and 2 were left at the end of the year.
When we stop and think about it, the reason for the massive rate of failure with this approach is somewhat obvious. We have not developed the prerequisite organizational capabilities to hire, on-board, feed, and manage that many salespeople at once. Let’s just reflect on the hiring piece for a minute. If a company decides to scale and establishes a plan to hire 10 salespeople next month, think about the new capabilities they need to find time for almost overnight. Think about how many in-person interviews are needed to land 10 great salespeople. Think about how many phone screens are needed. With the sudden surge of additional work on our already busy schedules, we rush through these efforts and make suboptimal hiring decisions. Furthermore, we don’t really know what we are looking for. We have never done it before. What if our hiring criteria are wrong? We have just multiplied an already expensive mistake by 10! That will probably kill our company.
For these reasons, we need to think about scale as a pace, not a single lump sum event. A best-in-class scale plan is not 10 salespeople next month and then see what happens. It is 2 salespeople a month for the next six months. If things break, we can stop and fix them. If they do not, we can go faster.
However, we still have not addressed the question “how fast?”.
Here is the answer. We should scale as fast as possible without losing product-market and go-to-market fit. Scale will compromise product-market and go-to-market fit. At this stage of our venture, the ten of us sitting around the office have figured out how to acquire customers, make them consistently successful, and do so in a profitable manner. However, can we now go out and acquire hundreds of employees over the next few years and teach them to do it? That is an even more difficult problem.
Therefore, we should scale as fast as possible without losing product-market and go-to-market fit. Fortunately, we know exactly how to measure product-market and go-to-market fit. In fact, we know how to measure leading indicators to inform us months in advance if these metrics look to be compromised. We use the leading indicator of customer retention chart we developed in the product-market-fit section and the leading indicator to scalable unit economics chart that we developed in the go-to-market fit section.
These two charts become our speedometer.

How fast should we scale? Establish a pace and watch the speedometer. If the speedometer breaks, slow down and fix the issue. If the speedometer looks good, accelerate. At the next board meeting, when our investors put pressure on us to scale as fast as possible, we can now come back to them with a predictable plan. “Our plan is to hire 2 salespeople a month for the next 6 months and monitor our leading indicators. If they are good, we will accelerate to 4 salespeople a month for 6 months. If they still look good after another 6 months, we will accelerate to 8, and so on.” Now we have a scientific, data-driven approach to scale.
Align go-to-market execution with the pursuit of growth
With growth comes a new set of risks. We mitigate these risks by aligning the components of our GTM strategy with growth.
Target Market: Separate into Scale vs. Experiment vs Ignore Segments
A sub-question to “how fast to scale” is “where to scale?”. We need to ensure that we scale the segments of our business where we have product-market and go-to-market fit and experiment with or disregard other segments. Relying on aggregated performance metrics that average all segments in the business can be very dangerous during the Growth and Moat phase. While the overarching customer retention and unit economics may look strong, they fail to provide the precision we need to accurately assess which segments are doing well and which are not. Said another way, consolidate metrics may be false positives where strong performance in certain segments masks weak performance in others. Without analyzing these segments separately, we run the risk of disproportionately scaling an under-performing segment and, overtime, compromising our aggregate performance metrics.
Inherent in the names, product-market and go-to-market, we have three dimensions by which to organize our segment analysis:
- The products we sell
- The markets we sell to
- The channels we sell through
Below is an example analysis along these segments for a fictitious company, “Acme Software”.
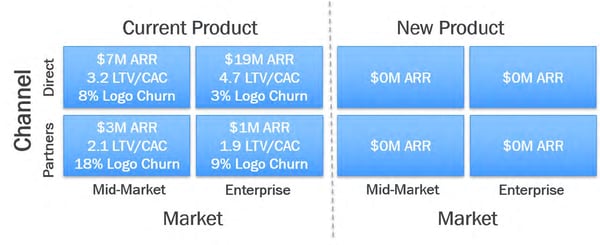
As the analysis illustrates, Acme Software is a $30 million business that sells a single product to both mid-market and enterprise buyers. Acme Software sells through a direct sales team and also through a partner program. The company targets an LTV/CAC above 3 and annual logo churn of under 10%. They are planning to launch a new product in the upcoming quarter.
As we analyze the company performance by product-market-channel segments, we see which segments are exceeding the company’s customer retention and unit economic goals and which ones are not. We can feel confident in scaling performing segments. For the remaining segments, we need to decide whether to experiment or ignore. An example decision outcome for Acme Software is below:
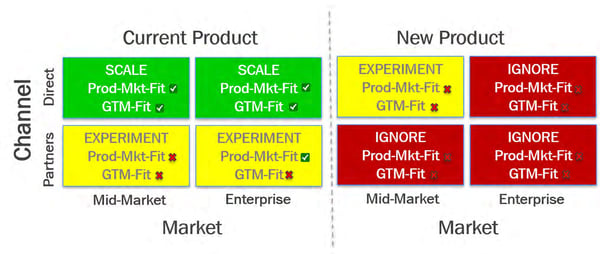
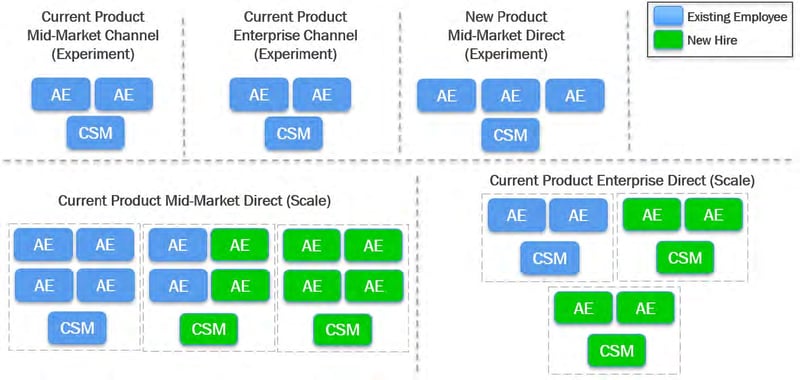
As the decision chart illustrates, Acme Software will scale the two direct sales teams selling their current product to the mid-market and enterprise markets. They will continue to experiment with the teams selling through partners. They will also experiment with a team selling the new product to the mid-market through a direct sales channel. The remaining segments will be ignored for now.
As they execute the experiment segments, they should follow the “product-market fit, then go-to-market fit, then growth and moat” sequence. The use of cross-functional teams in these segments will accelerate our achievement of product-market and go-to-market fit. Applying this strategy to Acme Software yields the following organizational structure:
GTM Playbook: Reinforced
During the go-to-market fit stage, we codified the GTM playbook. The playbook serves as the foundation for our new hire training. However, new hires will not simply read these guides and start executing them perfectly on day one. The playbook needs to be continually reinforced through an effective coaching cadence. This coaching cadence is a critical component of GTM management’s role.
Because success and failure is often highly quantifiable in GTM roles, especially sales roles, we can measure each salesperson by the stages of the sales funnel. Below is an example.
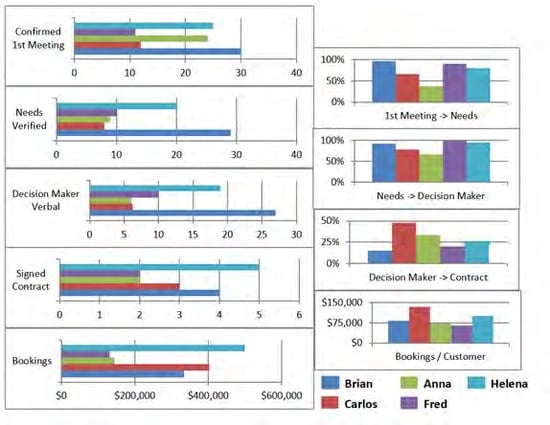
With these monthly metrics in place, we can now use them to diagnose specific areas of improvement for each salesperson, customize a coaching plan to each diagnosis, and quantify an improvement goal. An example coaching plan for the five sellers in the above dashboard is below:
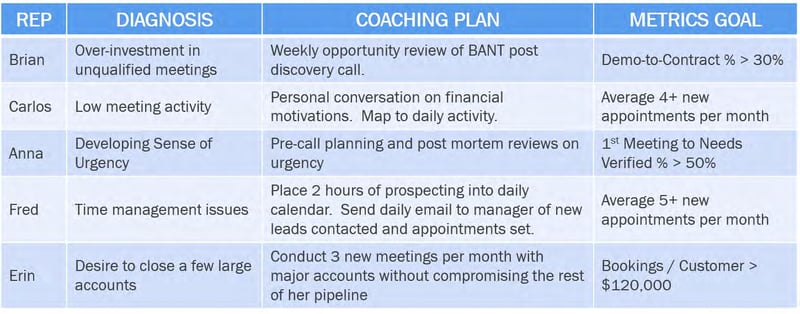
As the leader of our business, we should hold our GTM management layer accountable to this monthly cadence and leverage the quantified improvement goals to assess their effectiveness of their coaching.
Sales Hire: Process Executor
During the go-to-market fit phase, we focused our sales resources on codifying the GTM playbook. As we transition to the Growth and Moat phase, we are now ready to bring on the more traditional salesperson profile.
A common mistake when defining this profile is asking our peers at other companies what they look for in sales hires and copying/pasting. Having helped hundreds of companies hire thousands of salespeople, I can tell you that the optimal sales hire for you will be different than that for another business. The optimal sales hire depends on the context of the business, which is largely based on the product we sell, the market we sell to, and the stage we are at as a business.
However, because success and failure in sales is so quantifiable, we have an opportunity to engineer our ideal sales hiring formula. To do so, we list out the 5 to 10 attributes we think will correlate with success in our sales context.
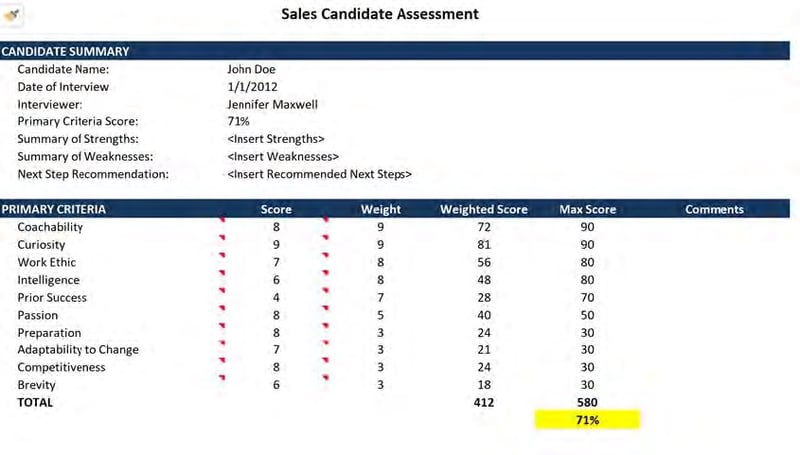
Be clear about the definition of each attribute and the definition of a high, medium, and low score.
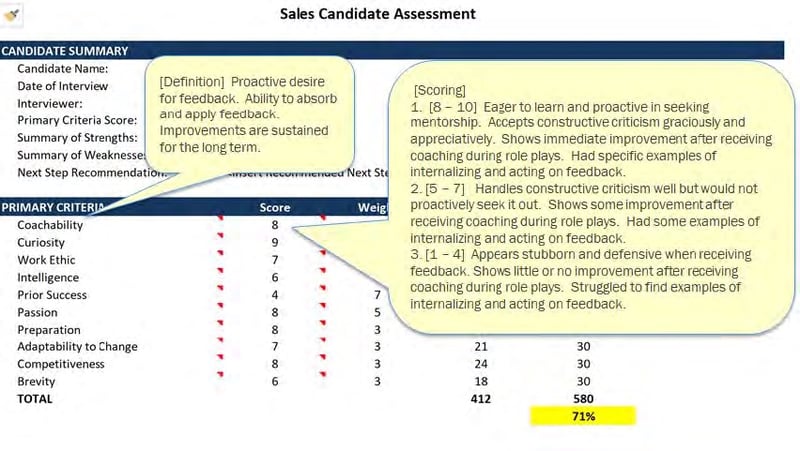
Devise a hiring process to assess candidates against these criteria and be disciplined around scoring them.
If we hire 2 salespeople a month for 6 months, we should have a good idea as to which salespeople turned into top performers at our company and which ones did not. We are in a position to ask ourselves why seller A is a top performer and why seller B is not. We can then look back to our hiring formula to see if we are adequately assessing candidates on these attributes and, if not, iterate the formula. Having this tested formula in place is a necessity when we start hiring 10 sales people per month. We should practice it early and often.
Demand Generation: Multiple Mediums Tightly Aligned with Sales
During the go-to-market phase, we tested 2 or 3 demand generation channels and proved at least one to be viable from a unit economics standpoint. However, each demand generation channel has a “ceiling”. We will need to unlock new channels to fuel follow on growth aspirations. The “Target Market” section above walked us through a strategy to do so.
Pricing: Assess for Disruption
During the go-to-market phase, we optimized our pricing for scalable unit economics. We can leverage that design during the Growth and Moat stage.
The major pricing mistake at this stage is more categorized around what not to do rather than what to do. The mistake occurs when a company raises prices without having a sustainable differentiation. This strategy can accelerate revenue in the short term but kill us in the medium term. Another way of describing sustainable differentiation is barrier to entry or “moat”, hence the phase label of “Growth and Moat”. A common reason for failure during the growth stage is entry by competition, causing our company to lose product-market or go-to-market fit. We need an effective “moat” to sustain growth.
We as entrepreneurs confuse sustainable differentiation with temporary differentiation. When I ask entrepreneurs about their sustainable differentiation, they often reference a product feature that they have and the competition doesn’t. Most of the time, that feature is a temporary differentiation, not sustainable.
A simple lens we can use to assess our “moat” strategy is to imagine that ten amazingly talented engineers from Google quit their jobs, formed a company to compete with us, raised $50 million from Sequoia, reverse engineered our product, and started selling it for half the price. Does this sound unrealistic? We would be amazed how often something like this happens. The key question is, under these circumstances, why do we still win? If so, we have a sustainable differentiation.
Here are a few categories of sustainable differentiation with examples in today’s software market:
- Network Effects: When a new user signs on, the value of the offering to the existing users
increase. The classic example is the telephone. The first phone was useless. As more and more people adopted it, the value to the existing users went up. A modern example is LinkedIn. When a new user signs up, additional connection routes through the network become available to existing users. Even if the talented team of ex-Google engineers replicate our product and sell it for half the price, we still win. - Brand/category: By defining a category and associate our brand as the market leader, we make it difficult for others to compete and win in the category. HubSpot did this with inbound marketing. As the company accelerated, new entrants latched onto the inbound movement. However, it only fueled demand for HubSpot.
- Viral distribution: Rarely does viral distribution happen accidentally. It is the result of countless experiments and iterations to maximize the viral coefficient. However, once established, especially with a reasonable user base, the company profits from essentially free growth. This effect occurred at Dropbox, where they presumably achieved a viral coefficient greater than 1 after lots of work on the capability. Ultimately, the channel yielded millions of free new users every month. While the talented ex-Google team can replicate the software, they cannot replicate the viral effect and install base overnight.
- Switching costs: A substantial investment needed by customers to move to a competitor. Salesforce.com benefits greatly from switching costs. Even if the ex-Google team built a CRM just as good, it would be challenging for a customer to port over all of their data and business processes to the new CRM.
- Learning algorithms: The more transactions our algorithm has processed, the more accurate it presumably is. Even if the talented team of ex-Google engineers replicate our product and sell it for half the price, we can still win as long as we have processed exponentially more transactions and the market values accuracy over price.
Getting back to price, companies with a temporary sustainable advantage may raise prices to drive revenue growth. In the short term, revenue accelerates as long as the temporary advantage exists. However, the higher price makes our business an even more attractive and easier target for disruptors. It is fine to drive average revenue per customer. However, use a “land and expand” model that keeps the opening price and friction low and expands revenue per customer as value is seen and trust is developed.
Compensation: Add promotion path
In the go-to-market fit phase, we implemented a compensation plan that balanced new revenue acquisition with customer retention by paying 50% of the commission on the contract signature and 50% on the customer retention leading indicator. This approach to sales compensation works well during the growth and moat phase to preserve product-market and go-to-market fit.
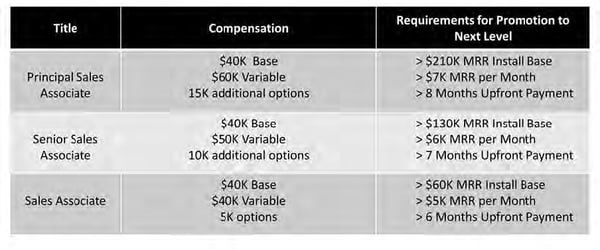
The opportunity we often overlook is using compensation to retain our GTM talent. It always puzzled me why we used the annual 3% raise approach with salespeople where, again, success and failure is so quantifiable. A concept I innovated with at HubSpot and then applied to many companies is an extension of the compensation plan called a data-driven promotion path. When a salesperson asks when they will get a raise or a title enhancement, rather than handling these requests with a subjective annual review process, we can use a data-driven promotion path. As a result, we can retain top talent for a lot longer. An example promotion path is below.
In addition to being promoted within the current role of salesperson, a critical capability for development in the growth and moat phase is the management layer. A major pothole we fall into when choosing our sales managers is to promote our best salesperson. The study below shows why this is a flawed approach.
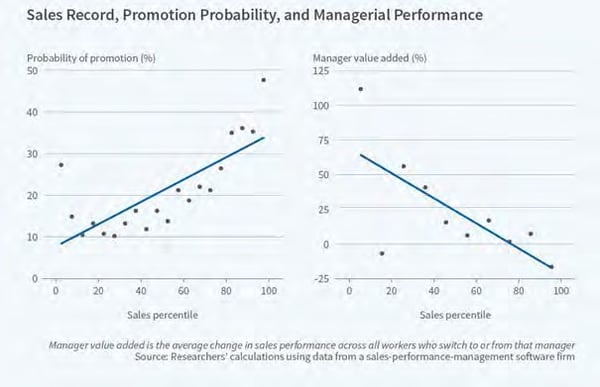
However, we can’t promote our worst salespeople to manager either. Therefore, we need to build a bench with a sales management development program. If we do not, available sales manager capacity can quickly become a bottleneck to scale.
Below is a four stage process to groom internal candidates through.
Phase 1 – Demonstrate adequate skills at each stage of the sales process
Industry data shows that the best salespeople do not make the best sales managers. Observers of this trend speculate the cause is the difference in task of the salesperson role, which can be very independent, and the sales manager role, which entails great people development skills. That said, the worst salespeople do not make great managers either. Our experience suggests that good sales management candidates have mastered each stage of the sales process at an adequate level. They do not have to be the best. They simply need to understand each component so that when they manage a salesperson with a deficiency at this stage, they can coach the person through it. Therefore, we recommend an advanced sales certification that sales leadership candidates need to pass, illustrating competence at each stage of the sales process, before being moved to the next stage. We also recommend they achieve goals for two quarters in a role be another prerequisite to moving to the next stage.
Phase 2 – Develop leadership skills:
After Phase 1, we recommend the sales leadership candidate be placed in a weekly sales leadership curriculum. Each week, the candidate reads assigned best practice literature on critical scenarios they will face as a manager, such as managing conflict, delivering effective feedback, and driving team morale. After each reading, the current sales leader will review the concepts and role play applications of the concepts to our company context. This phase will allow the candidate to better understand the day-to-day requirements of the job and assess whether they are passionate about the role. The phase will also allow leadership to assess the candidates performance in these leadership settings. The time burden on leadership should not be significant, amounting to an hour meeting with the leadership candidate each week. The candidate should continue to achieve their individual quarterly targets through the process.
Phase 3 - Practice Hiring and Coaching Skills with One Salesperson:
If the sales management candidate is still excited about the role after Phase 2 and leadership still believes in the candidate's abilities, we recommend the candidate recruit, interview, hire, on-board, and coach the next sales hire. Through the process, current sales leadership will interview candidates as well. However, they will ask the management candidate about their interview approach and assessment before revealing their own perspective. Current leadership will also coach the management candidate as they onboard and develop the new hire. The management candidate will continue to carry their individual quota through the process. This is temporary. This phase typically lasts 3 to 4 months.
Phase 4 – Promotion:
If the management candidate progresses through Phase 3 and a leadership position becomes available, we recommend the management candidate be promoted to sales manager and no longer hold individual quota responsibilities. Some organizations attempt a player-coach model. However, industry data and observations suggest this model fails most of the time. It is difficult for a manager to switch between individual quota and team development responsibilities. Oftentimes, one side suffers and it is typically the team development side as player-coaches feel they will not get fired as long as they hit their individual quota. We recommend the new manager be provided with a small team to start, ideally newer salespeople that will be easier for the new manager to develop credibility with, and take on most of the new hiring over the next few quarters. We recommend the current VP of Sales retain direct reports from the veteran top performers and take on minimal new hiring to their team.
What We Learned
- We are ready to scale when we have product-market-fit and go-to-market fit
- Scale is a pace, not a single lump sum event
- We should scale as fast as possible without losing product-market and go-to-market fit.
- Use the speedometer to determine the moment we lose product-market or go-to-market-fit
Conclusion
“When should we scale? How fast?”
