
.png?width=760&height=550&name=Whats%20wrong%20with%20LTVCAC%20(1).png)
How are you measuring sales efficiency and customer value?
If you use LTV:CAC, you’re not alone. When I speak with founders about tracking metrics, 90%+ of conversations include this as a north star measurement of success: “4:1 LTV:CAC! We’re doing well.”
But how can you be sure?
Here’s my hot take on how LTV:CAC fails to accurately reflect the health of the business and how sales efficiency and customer success should actually be measured:
- LTV:CAC is calculated using three variables (Average Rev Per Customer, Churn, and CAC) based on a point in time, which doesn’t factor in customer behavior that changes over time and which variable drives that change.
- At the early-stage, almost nothing is fixed (ie. Ideal customer profile (ICP), pricing and packaging, GTM motion, retention, the product, etc) and so the notion of quantifying “lifetime value of a customer” at a single point in time just doesn’t make sense and can over or under estimate what happens at scale.
- CAC will also be fairly inconsistent due to a whole host of variables, including any experiments impacting GTM, like paid ads as an example. Thus, taking a single CAC number will be hard to use as a fixed assumption in the LTV:CAC calculation.
- More businesses are moving towards “land and expand” or consumption-based pricing so the three variables change frequently, even daily in some instances. By simplifying these three variables into a single number, you lose visibility into which variable drives changes over time and therefore, how to pinpoint which specific actions to take.
- Instead, looking at monthly customer cohorts to track sales efficiency and assess customer value accretion over time is a much more effective way to capture and evaluate trends in customer behavior over time.
- Calculate CAC per each cohort and measure how long each cohort takes to break even on CAC, what I call the Cohort Customer Acquisition Cost Payback equation (CCAC Payback).
- Analyze customer revenue contribution by looking at how cohorts perform over time using what I call a Customer Value Analysis (CVA).
Rather than track traditional LTV:CAC, I suggest looking at longitudinal data and isolating trends that are happening within a single cohort and across multiple cohorts. This can be done by looking at CCAC Payback (Sales Efficiency) and running the CVA to track revenue per cohort over time (Net Dollar Retention).
.png?width=700&height=233&name=Pull%20Quote%20%201%20vF%20(1).png)
Let’s explore further...
LTV:CAC ignores changes in customer behavior over time
Traditionally, LTV is calculated by dividing average revenue per customer by revenue churn. But this fails to reflect the true performance of the business.

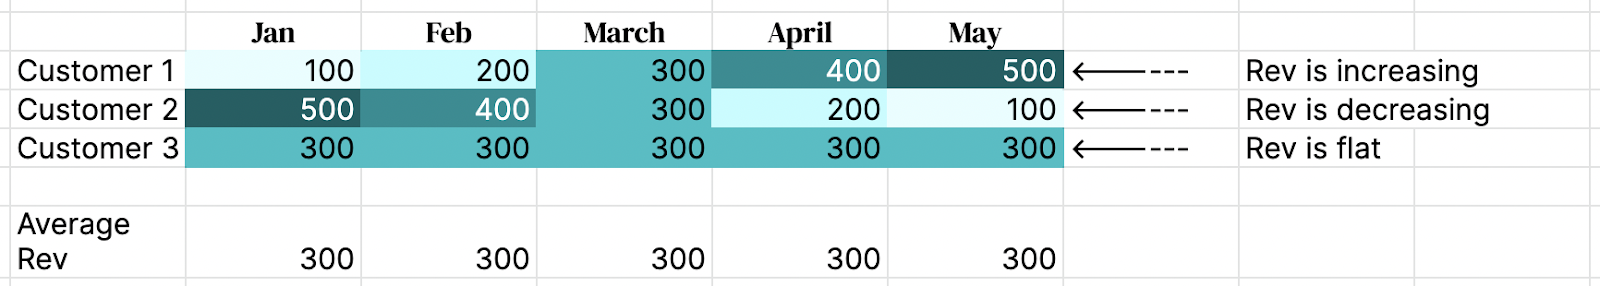
Let’s start with the numerator – Average Revenue per Customer or ARPC. Firstly, averaging revenue across a customer base does not give a granular enough view of how each customer actually performs over time. In the example below, each month has the same “average revenue per customer,” however, each customer has a drastically different experience with the product and therefore, signals different issues to analyze:
Secondly, and more importantly, ARPC obscures the potential trajectory of customers. Say you have 10 customers that grew from $1K a month in revenue in Month 1 to $10k in month 8. Next, you acquire 10 customers that are paying $1k in month 1. What is the Average Revenue per Customer? Mathematically, the answer should be $5.5k but I’d argue that the static average obfuscates the true behavior of the customers. Just taking the traditional ARPC ignores the potential growth of your new customers over the coming 8-month period. If those 10 customers perform at the same rate and get to $10K a month by month 8 as did the first 10 customers, then holding everything else constant, that ARPC calculation would be different (off by ~2X $5.5K vs $10K).
Illustratively, here is a point in time look on Average Revenue per customer:
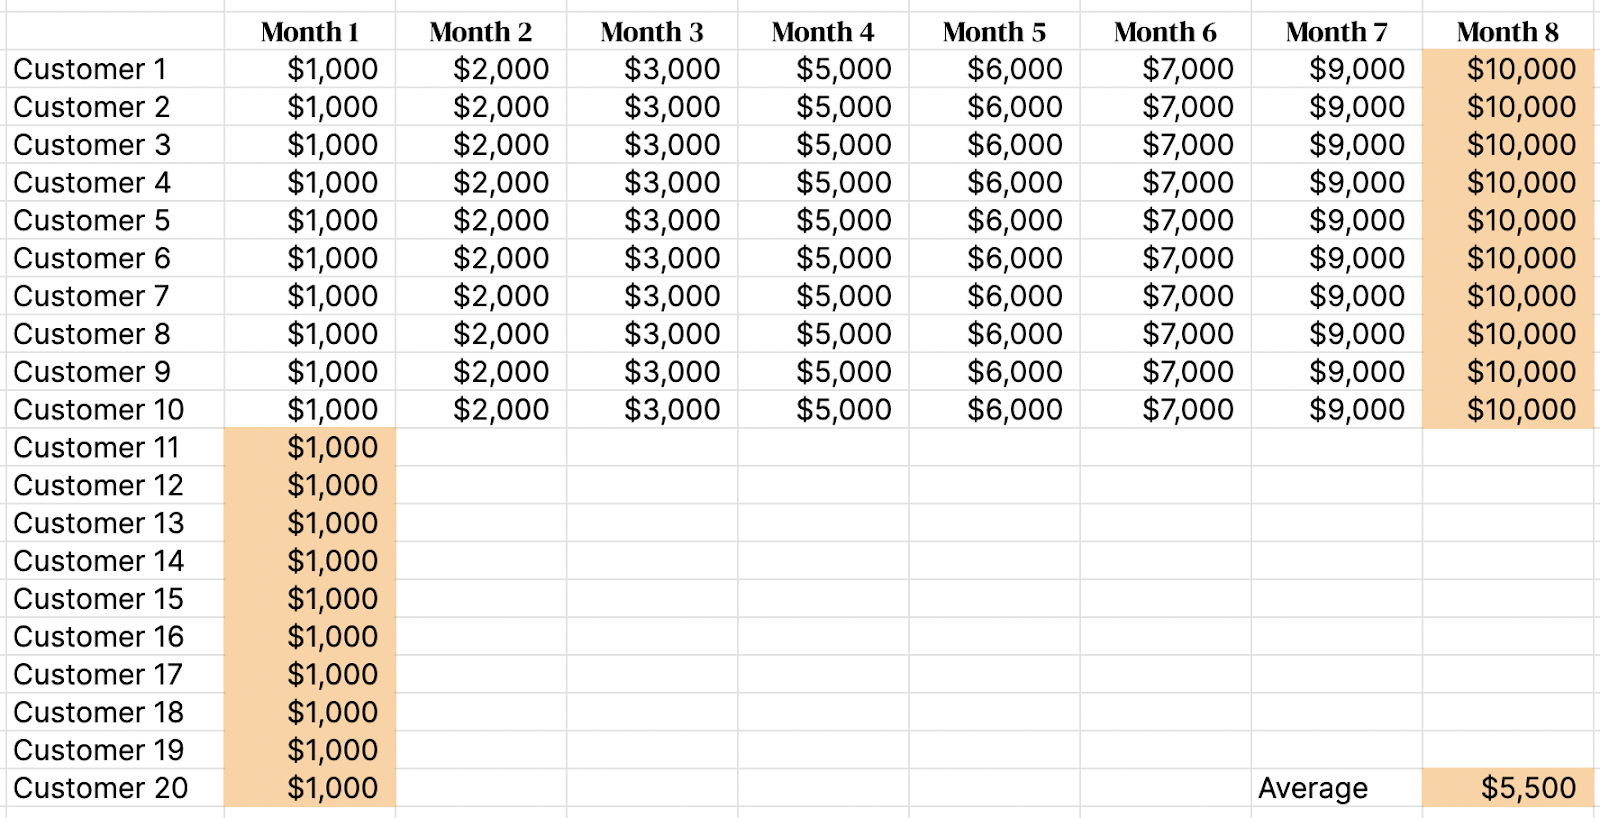
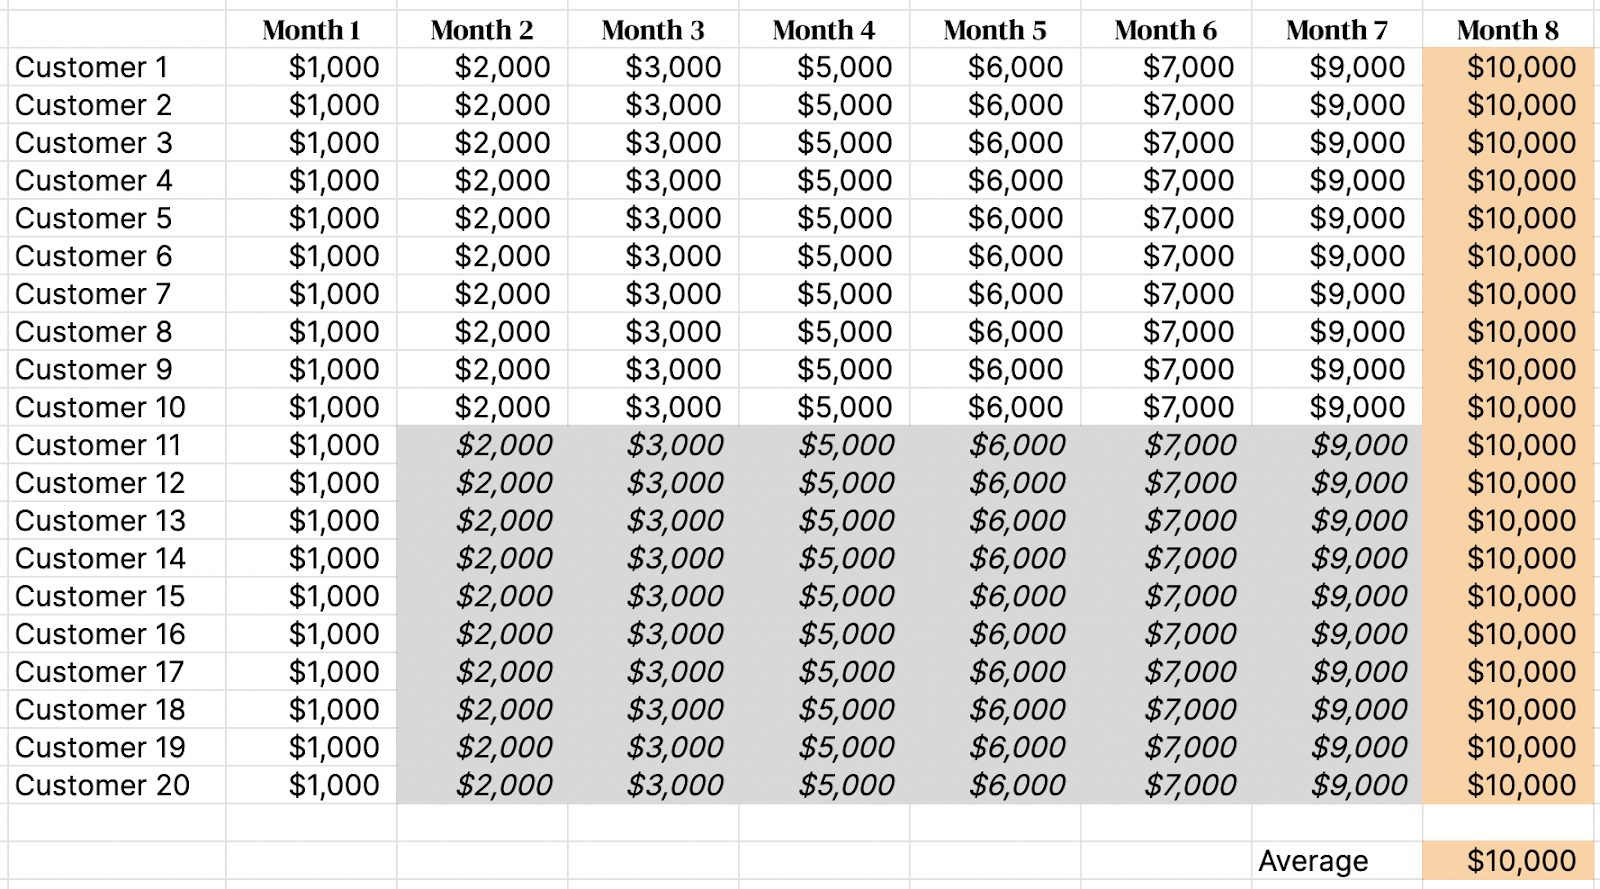
If you don’t factor in the longitudinal data of cohort behavior over time, the calculation of average revenue per customer can be way off (in this case a factor of 2X):
And even if we looked at just the new set of customers and excluded the 8 month old customers, the ARPC would be $1K (10 new customers acquired at $1K in average revenue per customer) but this would still face the same issues of missing observations on customer behavior. The point in time calculation isn’t useful.
Traditional ARPC math would lead you to miss a key signal that customers can grow 10x in 8 months, which is crucial to incorporate into the analysis. What if a customer in month 13 is paying $15k? A point-in-time analysis doesn’t give the business the credit it deserves for future ARPC growth.
%20(1).png?width=350&height=350&name=Pull%20Quote%202%20(550%20%C3%97%20550%20px)%20(1).png) Since “land and expand” and consumption-based pricing are becoming more and more common, it’s even more important to track revenue contribution over time vs use ARPC at a single point in time.
Since “land and expand” and consumption-based pricing are becoming more and more common, it’s even more important to track revenue contribution over time vs use ARPC at a single point in time.
Now, let’s look at the denominator (Revenue Churn). Is there an early-stage company that fundamentally knows its steady-state revenue churn? Unlikely. Also, what happens if customers are expanding and there is net negative churn (ie. retention above 100%)? The math doesn’t mean anything with a negative LTV. Early-stage companies are usually focused on tweaking the product, honing in on ICP, and experimenting with pricing and packaging (ie. testing freemium and free trials). There are hardly ever definitive data points that can determine what steady-state churn is when there are so many variables changing rapidly.
Finally, let’s turn to CAC. Similar to Revenue Churn, the CAC in LTV:CAC is a single point in time measurement and, at an early stage, fluctuates as the company grows and experiments with different go-to-market motions. Paid marketing, content marketing, attending conferences, and hiring headcount that needs time to ramp can all influence CAC, especially in the beginning before efficiencies are realized. You should isolate revenue churn and observe how it changes.
So, what should be used instead? Cohorts.
In the early stages of rapid experimentation, it takes time to fully optimize each element of the business. As I’ve stated, so many variables change the cost to acquire a customer, the value of that customer, and the retention of that customer. If you’re running an SDR playbook, the time to hire, ramp, train, coach, etc will dramatically change productivity, which inherently changes CAC.
.png?width=700&height=234&name=Pull%20Quote%20%203vF%20(1).png)
So instead, the first key analysis I would run is a CCAC Payback analysis - calculate the CAC per cohort (CCAC) and then see how long it takes each cohort to pay back the CCAC (ideally on a gross profit basis). There are two key elements to calculating CCAC. First, find the fully-loaded cost to acquire a cohort of customers. These costs should include all costs related to selling that cohort (i.e. marketing spend, sales team salaries, commissions, sales tools, etc.). Next, factor in the sales cycle. For the purposes of this article, we’ll assume a one-month sales cycle — this means we’re going to calculate the fully loaded CAC one month before the cohort starts. So, the fully-loaded cost of Sales and Marketing in January will be the CCAC for the cohort starting in February.
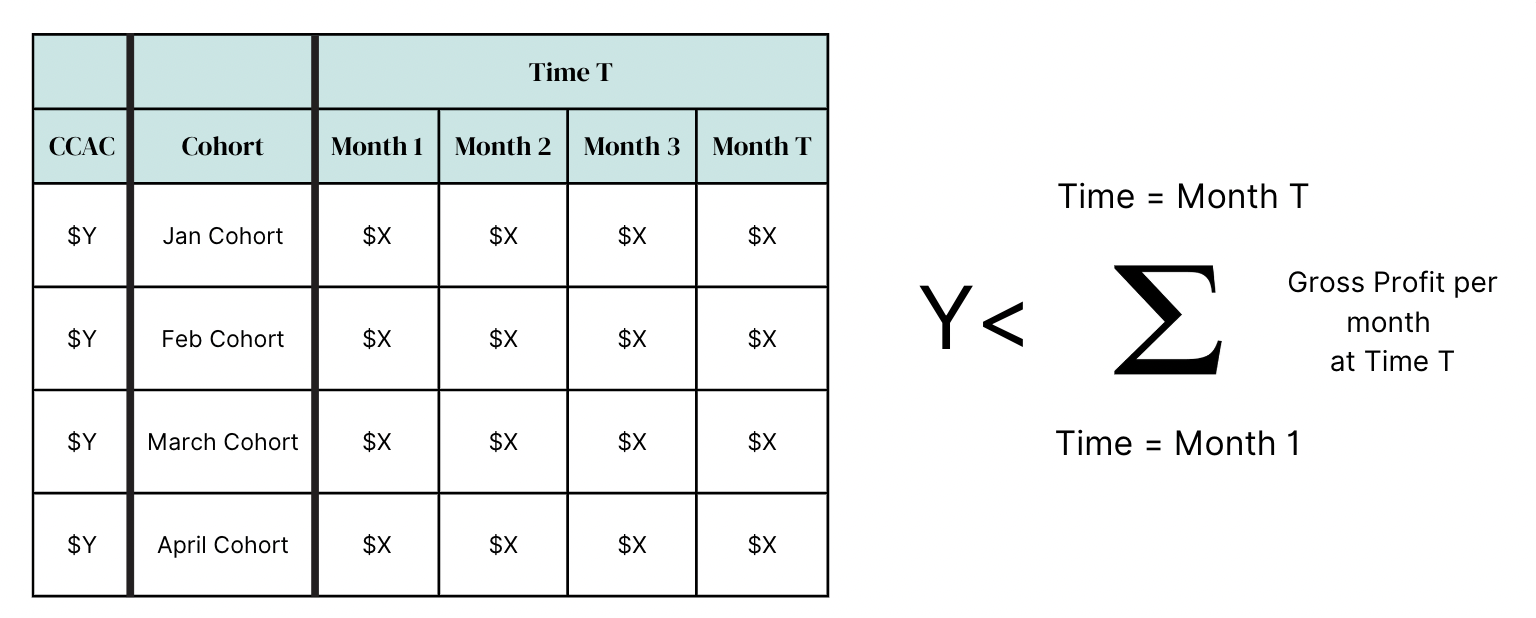
Now, let’s look at the actual cohort performance. Here we want to track the monthly gross profit per customer cohort that started in the same month. So now we have both the CCAC (Y) and the gross profit per cohort (X) across cohorts (Jan cohort, Feb cohort, etc).
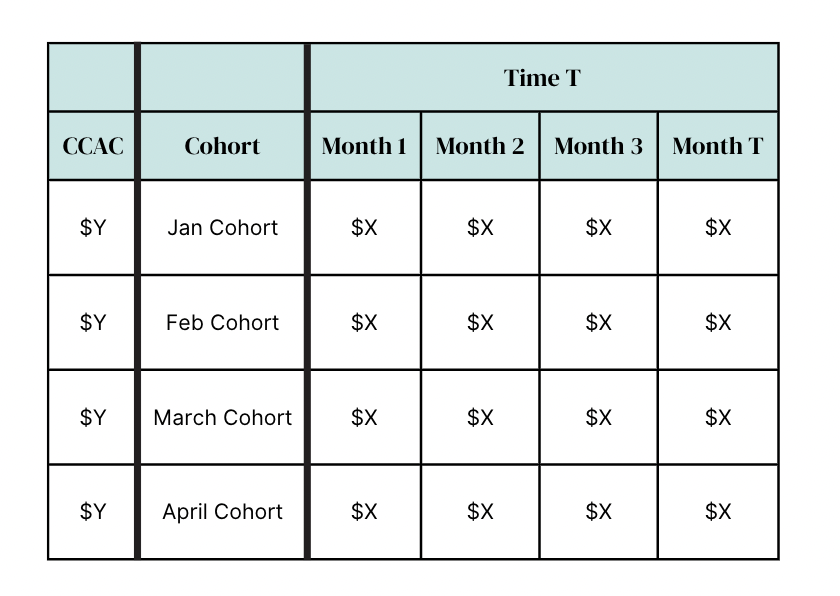
To use the CCAC Payback model, we want to see at what point (which month T) does the sum of gross profit per month (X) surpass the CCAC (Y) for each cohort:
Now, let’s look at an example of CCAC Payback that is improving. In the below graphic, we see each cohort per row starting with February customers (acquired by sales and marketing spend that happened in the prior month.). The numbers outlined across the row are the gross profit contribution per cohort in each respective following month. As we look to the right, each column tracks a new month (Month 1, Month 2, etc) and the cumulative gross profit each cohort is contributing through that specific month. Highlighted in orange, we see the time when the summation of gross profit contribution (cumulative gross profit) overtakes the CCAC. This is the CCAC Payback. Comparing across cohorts, we look down each row and you can see the CCAC Payback (orange highlighted cells) moves to the left meaning it takes fewer months to repay 1x CCAC. This shows signs that the sales machine is improving and becoming more efficient.
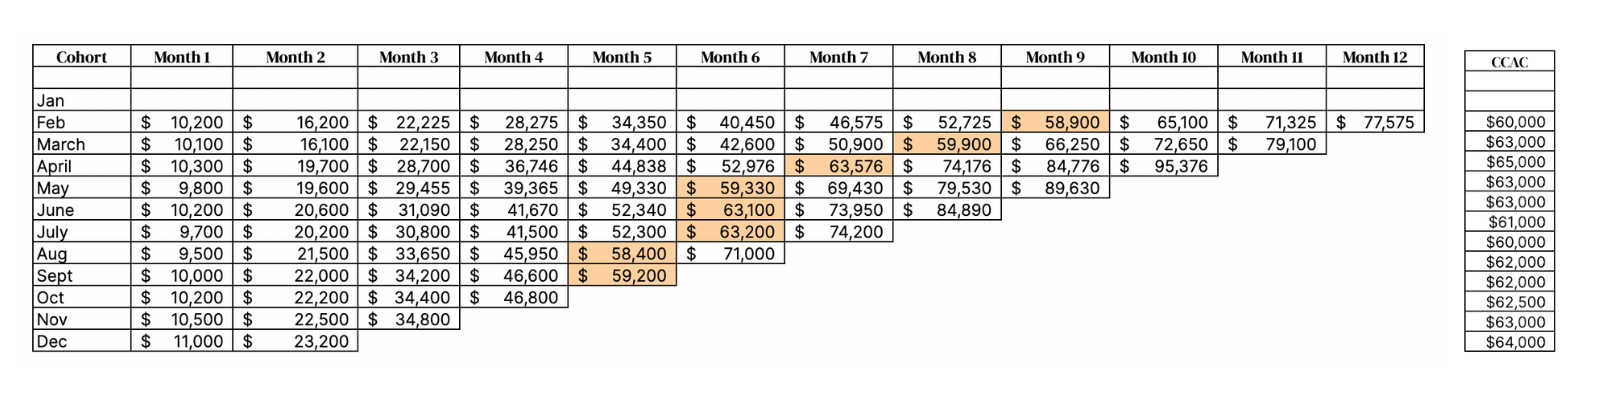
You should regularly evaluate this analysis to gauge whether the experiments are working and if the CCAC Payback time is shortening.
Inversely, here’s an example of CCAC Payback getting worse. The time to pay back CCAC (Y) is getting longer which means the sales efficiency is getting worse and we need to dissect why.
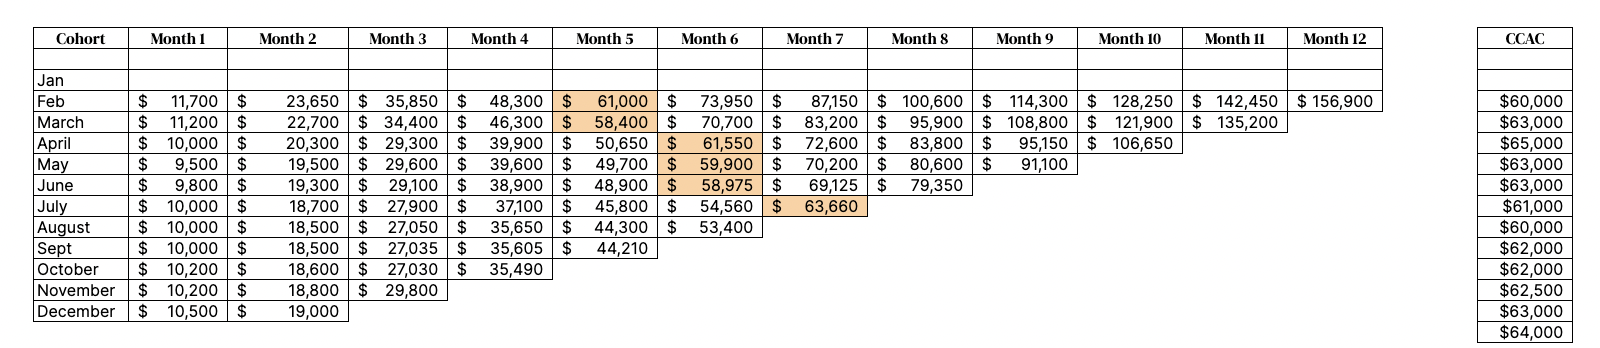
What is important to point out is these cohort rows compute attained gross profit contribution, not theoretical contribution. This means we are using the cumulative gross profit contribution per cohort in order to calculate the true payback.
Target CCAC Payback should be as follows:
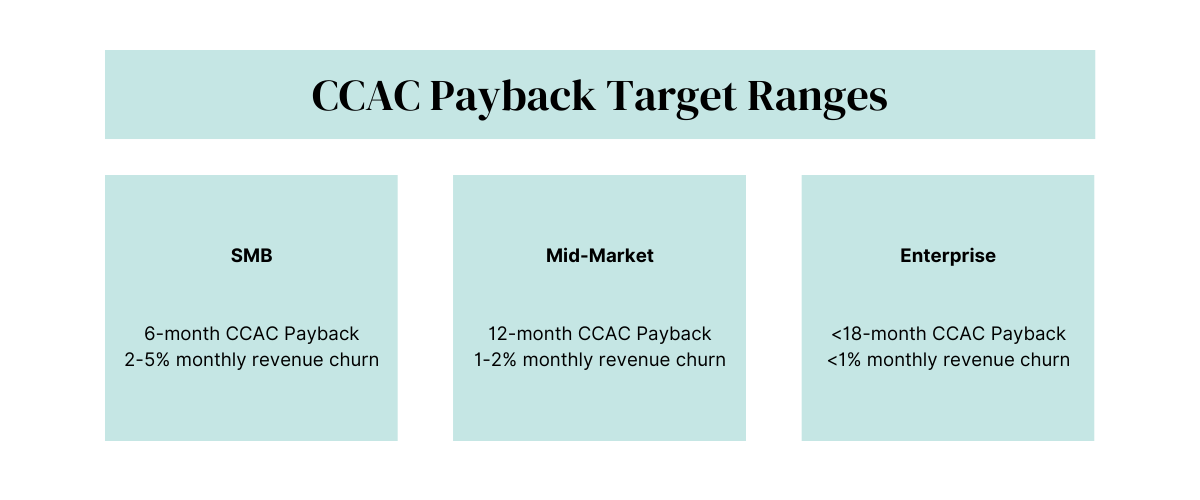
As long as the CCAC Paybacks fall within this range, you will know you have an efficient sales engine.
.png?width=700&height=233&name=Pull%20Quote%20%204vF%20(2).png)
Now, the second key analysis I’d run to evaluate the growth of a cohort over time is the Customer Value Analysis. This exercise tracks Net Dollar Retention (NDR) within a cohort to see if revenue per customer is increasing (via upsells or expansion) or decreasing (via downgrades or churn) over time. Seeing NDR at the cohort level is a more granular and useful way of tracking customer revenue retention as opposed to averages or year-over-year calculations. For each cohort, track the percentage of each month’s revenue contribution (month 2, month 3, etc) as compared to the starting month’s value (month 1).
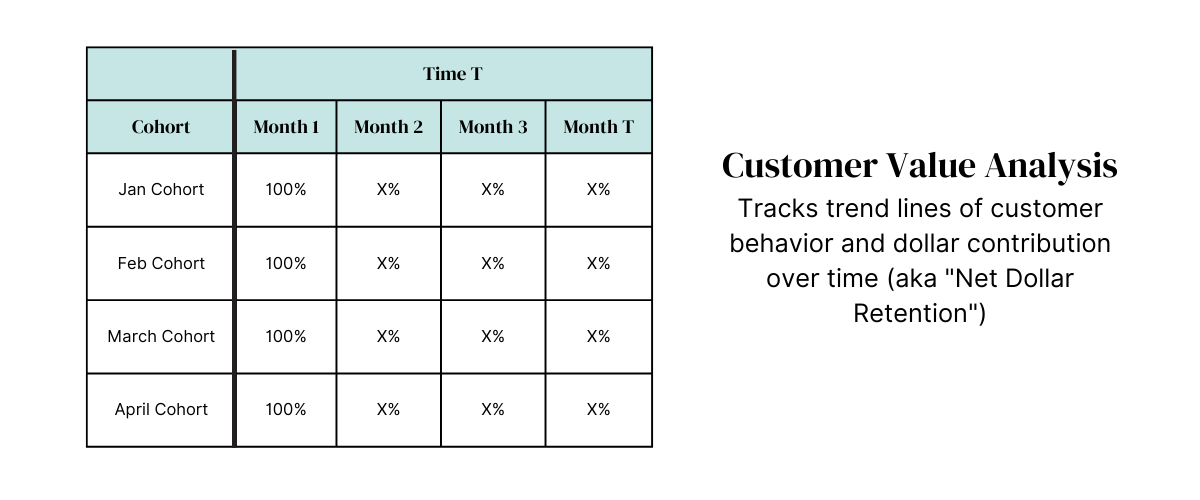
In the above chart, we see each cohort start at month 1 with 100% of revenue retained and then each month thereafter will have new revenue numbers that should be compared to month 1 as a percentage.
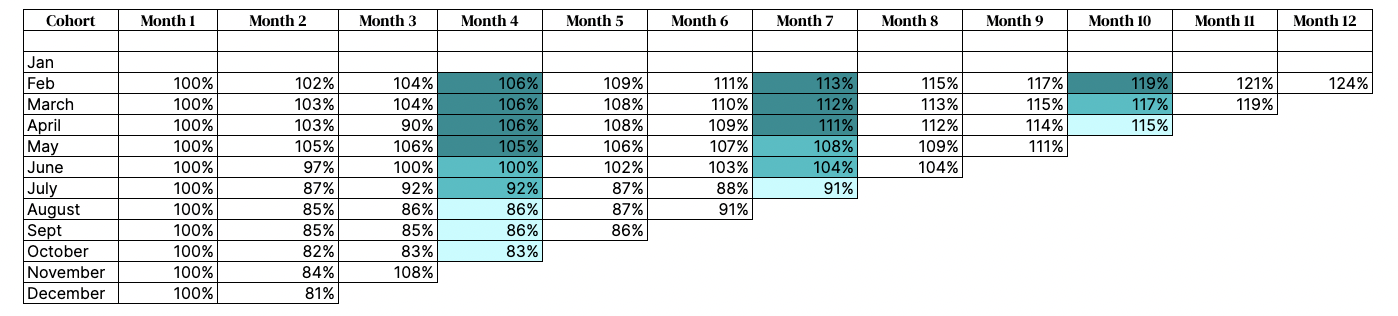
As an example below, this CVA is showing growth in customer value. Looking both within and across cohorts (eyes moving from both top-to-bottom and left-to-right on the chart), we see the NDR improving. For early stage companies, this means experiments being done like product enhancements, investments in customer success, and onboarding improvements are probably working.
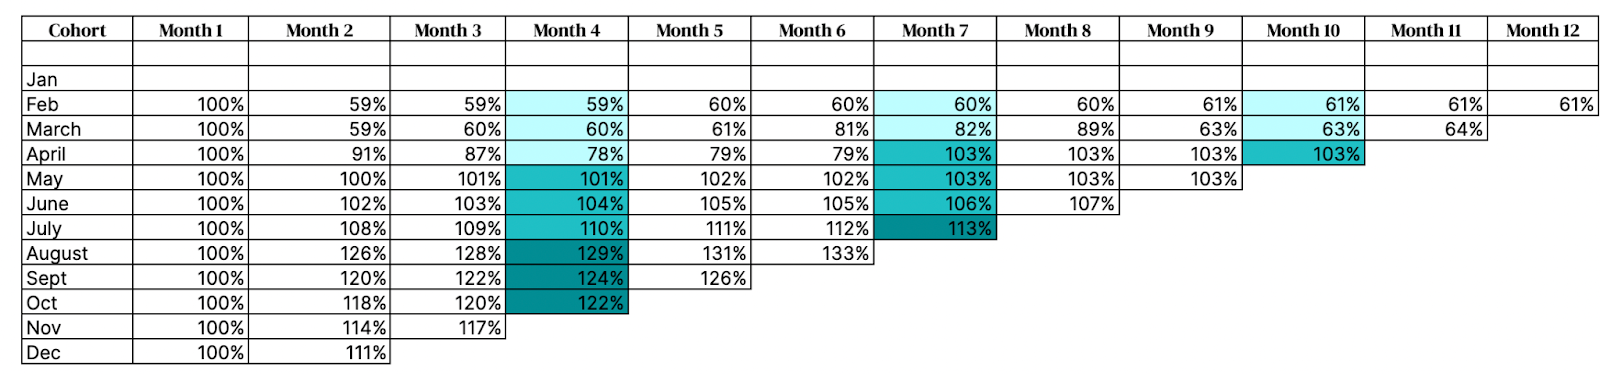
The below chart shows cohorts that are getting worse. Looking from top to bottom, you can see the revenue retention percentages are decreasing over time, which means NDR is getting worse for newer cohorts.
For all types of businesses, the highest quality cohort performance is above 100% NDR. Churn is a leaky bucket that plagues any businesses with a churn problem so achieving above 100% NDR is a general goal. Best company performance is to achieve 120-150% annual NDR consistently across all cohorts (improving NDR across cohorts is even better).
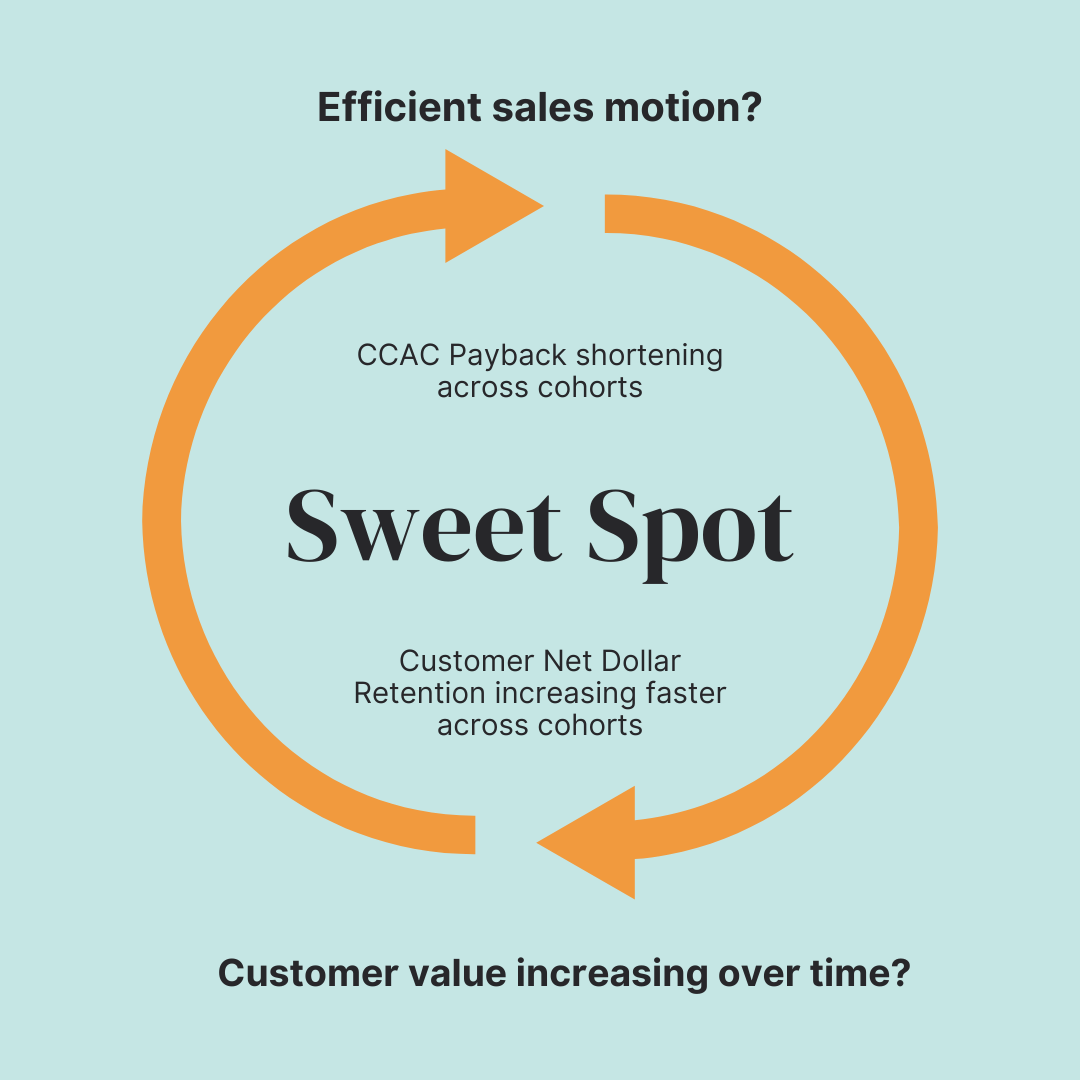
In summary when looking at cohort performance, we want to ask two questions:
- Is the payback improving, i.e. are we able to breakeven on CCAC sooner in more recent cohorts as compared to older ones?
- Are cohorts growing and showing signs of expansion over time? Do we see new cohorts expanding faster than older cohorts in the CVA?
To assess sales efficiency and customer health, I strongly suggest early stage founders use these frameworks rather than LTV:CAC. CCAC Payback and CVA offer more granular insight that can be used to monitor performance at the cohort level and, ultimately, help you make better decisions in building your company for the long run.