The 2024 Stage 2 Capital Catalyst Curriculum is in full swing, and we're excited to bring you insights from our Module #2: Go-to-Market Fit.
Last week, we explored Stage 2’s Science of Scaling method and its first pillar of Product-Market Fit with Mark Roberge. This week, we're diving deeper into the next crucial step: understanding when and how to scale your go-to-market efforts. We're tackling the question:
How do you measure and optimize Go-to-Market Fit?
In Module #1, Mark shared a framework to identify when a company is ready to scale. He broke it into two distinct areas:
- Product-Market Fit (PMF): This goes beyond just revenue numbers. It's about customer retention and consistent value delivery.
- Go-to-Market Fit (GTM Fit): Understanding the economics of your customer acquisition and service model.
While PMF ensures you have a product that customers want and will keep using, GTM Fit is about finding efficient and sustainable ways to reach and serve those customers.
Jay Po, Co-Founder and Managing Partner, and Anu Maheshwari, Partner at Stage 2 Capital, led this session on how to find and measure GTM Fit. They break down the essential components: unit economics, efficiency metrics, and cohort analysis.
As we move into our second module, it's important to understand how this builds on what we learned last week. In our first session, we explored Product-Market Fit, focusing on retention, usage, and early customer success. Now, we move to Go-to-Market Fit which focuses on scalable unit economics.

Jay emphasized that this module's timing is intentional. It's designed for founders who have started to gain traction, bring in revenue, and organize their metrics. As a founder, you've done unscalable things to bring in customers and prove consistent value by measuring LIR. Now, the big questions are: How do you scale? How do you bring on the next set of customers in a way that is economically efficient?
This is where unit economics comes into play. As Jay pointed out, at this stage of your startup journey, two questions become paramount:
- How do you quantify your progress accurately and scalably?
- What are the most important metrics to track?
Let's get into how unit economics can answer these questions and set you up for sustainable growth.
Understanding Unit Economics for Go-To-Market Fit
Jay kicked things off by emphasizing the importance of unit economics:
"A key part of scaling, especially early on, is getting into that muscle memory of your unit economics and your leading indicators of unit economics."
In our session, Jay and Anu introduced four key ways of measuring efficient growth:
- CAC Payback
- Growth Efficiency
- Rep Efficiency
- CCAC (Cohort Customer Acquisition Cost) and Cohorts
These metrics give a comprehensive view of your business' efficiency and scalability. But before we get into each of these, let's address a key question:
Why are unit economics so crucial?
Anu explained two primary reasons:
- They help us understand the output based on our input of investments. In other words, for every dollar we spend to get a customer, how much revenue are we generating?
- They answer the crucial question: When are we ready to scale? Unit economics provide a clear signal about the health and scalability of your business model.
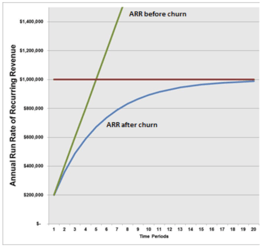
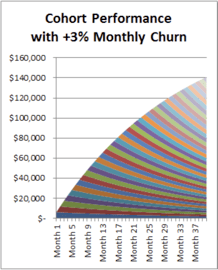
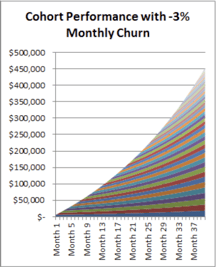
Calling back to Leading Indicators of Retention from Module 1: PMF, Anu highlighted churn’s impact on growth and the relationship between churn and unit economics using four illustrative charts*:
- CAC Payback: This chart shows how the speed of recouping Customer Acquisition Costs affects profitability. The quicker you recover these costs, the faster you reach unit profitability.

- Churn Impact: Even with growing Annual Recurring Revenue (ARR), high churn can create a cap on retained ARR. This chart shows how churn can create a "leaky bucket" scenario, where new customer acquisition barely keeps up with customer losses.

- Cohort with Churn: Using an example of 3% monthly churn, this chart shows how cohorts decline over time. You can see how even seemingly small churn rates can significantly impact your customer base over time.

Cohort with Negative Churn: In contrast, this chart shows the power of expansion. With a -3% monthly churn (meaning 3% expansion), cohorts grow over time, leading to compounding growth.

Remember, customer retention and expansion are just as important as acquisition when it comes to sustained growth.
Key Metrics for Measuring Efficient Growth
CAC Payback
When it comes to CAC payback, Anu shared that it's common for founders to underestimate their true CAC by only considering external marketing costs such as costs associated with social media and search ads. This can lead to a skewed understanding of your unit economics. CAC should be “fully loaded” (meaning it takes into account all costs that go into customer acquisition), including:
-
Salaries of sales and marketing (fully loaded On-Target Earnings or OTE)
-
External costs from campaigns
- Any other sales and marketing expenses
- Any other sales and marketing expenses such as costs for sponsorships, events, sales and marketing team travel and accommodation costs (if related to customer acquisition activities), and sales and marketing related software tools (such as CRM and Marketing Automation software)
A key insight Anu shared was the importance of gross margin weighting in our calculations. It's easy to fall into the trap of only considering revenue and CAC, but this approach misses a crucial element: Gross margin.
Gross margin is vital because it accounts for the variable costs of revenue. Anu reminded us that “when we're aiming to understand our true unit economic profitability, we need to think in terms of gross margin weighted payback. This approach gives us a more accurate picture of our business's health and scalability.”
By factoring in gross margin, we're not just looking at how much revenue we're bringing in versus our acquisition costs. Instead, we're considering how much profit we're actually generating after accounting for the costs associated with delivering our product or service. This will become really important for making informed decisions about scaling GTM efforts.
Key SaaS Efficiency Metrics
When it comes to the key SaaS efficiency metrics, there are two primary ones to focus on:
Magic Number: This is a rule of thumb to get to an easy ratio to understand the health of the payback in a business.
(Gross New ARR * Gross Margin) / Sales & Marketing Spend
- Aim for 1x or higher; 0.8x - 1x is considered good
- This metric gives a quick ratio to assess the health of your payback
Gross Margin Adjusted Payback:
Total Sales & Marketing Spend / (Gross New ARR per New Logo * Gross Margin)
- SMB: Aim for 12 months or less
- Mid-market: 12-24 months is acceptable
- Enterprise: Longer paybacks are common due to longer sales cycles, but also highly sticky customers with high upsell and expansion potential
Growth Efficiency:
While CAC Payback focuses on sales and marketing efficiency, Growth Efficiency takes a broader view of your business's financial health. This metric considers the overall cash profile of the business, providing insight into how efficiently you're using your capital to drive growth.
Growth Efficiency Formula: Cash Burn/Net New ARR
Anu provided some benchmarks for Growth Efficiency:
- 1:1 ratio is extremely strong
- 2:1 or 3:1 is common for early-stage startups
- The goal is to get as close to 1:1 as possible over time, and eventually to no burn followed by positive cash flows
Anu explained, "Ultimately, for any business, no matter what the ICP is or the type of product, if you have a ratio of one to one, where you burn $1 and you generate $1 of net new ARR, that is considered extremely strong."
Rep Efficiency:
While overall sales and marketing efficiency is crucial, you’ll also need to zoom in on performance of individual members on your GTM team. This is where Rep Efficiency comes into play. This metric helps you understand how effectively your sales representatives are converting their efforts into revenue.
Rep Efficiency Formula: Quota Attainment / OTE
Anu provided rough benchmarks for Rep Efficiency:
- Enterprise: 5:1 ratio
- Mid-market: 4:1 ratio
- SMB: 3:1 ratio
Anu explained the rationale behind these benchmarks: "The reason why, as you go more down market, those ratios come down is because those segments are typically just higher velocity. They often have higher churn as well, which means that, because they're higher velocity, the business is growing at a clip where that rep is constantly adding revenue in quick succession over time to their business.
CCAC and Cohorts

While many startups focus on the LTV to CAC ratio as a key metric, and it's widely accepted in the industry as a way to measure unit economics, Jay introduced a different approach that he believes provides more actionable insights. He shared his reservations about leaning too heavily on the LTV to CAC ratio:
"The short answer is, LTV to CAC is a point in time. It's a snapshot of your LTV and CAC today, and both of them are always changing."
Jay argued that this static view misses crucial information about how your business is evolving over time. To address this limitation, he introduced the concept of Cohort Customer Acquisition Cost (CCAC):
Instead, he recommends looking at Cohorts:
This approach allows you to:
- Track how each cohort performs over time
- Identify trends in efficiency
- Make data-driven decisions based on cohort performance
Jay noted, "You have so many more learning cycles to see if you're improving or getting worse. This articulates the trend line of your efficiency."
This concept is best understood when you hear it directly from Jay. Let's watch as he breaks down this approach.
For an in-depth review of CCAC Cohorts, Jay has written extensively about this topic on his blog article, LTV:CAC is a misleading metric to measure performance — here’s what to track instead.
Essential SaaS Go-To-Market Metrics
After diving deep into the weeds of unit economics and cohort analysis, Jay brought us back up to the surface with some practical advice. "Taking all that together," he said, "what does tracking look like at a high level?"
Jay talked about the importance of having a set of key metrics ready for quick reference, especially when talking to investors or your board.
These high-level metrics aren't meant to replace the detailed analysis we've discussed, but rather to complement it. They're the numbers you should have "in your back pocket," as Jay described it. Let's look at these key metrics and what Jay considers "great" performance for a company at around $1 million ARR:

Jay noted, "Of course, there's a spectrum and a timing... And over time, when you get to 5 and 10 million of ARR, this changes."
He also outlined how these metrics align with different stages of your company's growth:
- Product Market Fit: Focus on retention
- Go-to-Market Fit: Focus on payback
- Scaling: Focus on revenue growth, cash position, efficiency, and cash burn
By tracking these metrics quarter over quarter, you can quickly assess your progress and identify areas that need attention. As Jay summarized, "This is what we track. Hey, how are we doing quarter over quarter related to each of these core question sets, right? Do we have our cohorts tracked? Do we have our unit economics track? Do we have our plan in place for growth?"
Go-To-Market Fit: Key Takeaways
- Start tracking cohorts as early as possible. This will give you valuable insights into customer behavior over time.
- Focus on leading indicators of unit economics. These will help you make proactive decisions about your go-to-market strategy.
- Use CCAC and cohort analysis to identify trends and make data-driven decisions. This approach gives you more frequent learning cycles.
- Adjust your metrics based on your company stage and ICP (Ideal Customer Profile). What's "good" for an enterprise company might be different for an SMB-focused startup.
- Remember that tracking is more important than achieving "best-in-class" metrics early on. As Jay put it, "Lean more into what it looks like versus how it looks."
Get Hands-On: We've put together a bottoms-up model for tracking and analyzing your key Go-to-Market metrics. Use this template and customize it for your company.
That's it for this week!
Stay tuned for our next Inside Catalyst post, where we'll get into module #3 Developing the first Go-To-Market Playbook. As always, feel free to drop your questions in the comments!
*Charts: David Skok, https://www.forentrepreneurs.com/saas-metrics-2/

