
Title photo credit: Stand With Main Street and Lukas Blazek
Across the globe, almost every startup has had to throw out their original forecast and start from scratch. Projecting the year-end ARR or next set of hires no longer follows the simple equation of taking last year’s number and multiplying by 2 or 3. So where do we start?
In short, we recommend getting a deep understanding of your revenue metrics by matching the output from demand gen with sales capacity to recreate revenue forecasts and make budget decisions. At Stage 2 Capital, we work with our portfolio companies on what we call the “Bottoms Up Growth Model” and with a couple hours of extra effort, this exercise can increase forecasting visibility using a quantitative lens. Even post-COVID, following this model can help set the pace for scaling to achieve “profitable growth.”
The Bottoms Up Growth Model is meant to be straightforward. In essence, it allows you to build revenue targets for upcoming quarters, taking into consideration actual fundamentals of your go-to-market metrics. These factors include how many reps you have, how fast they ramp to reach full quota, how many leads they need, what conversion rates are, how long your sales cycle is, and how much net MRR you’re likely to close. These key questions are often overlooked resulting in missed revenue targets simply because of poor planning, not execution. If you have too many reps and too few opportunities, quota production will suffer and overall morale will go down. On the flip side, if there are too many leads and not enough capacity, then you’re scaling too slowly and leaving deals on the table. Once you extract long term revenue goals from historical sales and demand gen metrics, you can better predict your future hiring needs, offer more accurate projections to your Board, and more importantly, enable your team to reach peak performance.
Here are the common questions often overlooked when rushing to scale the team too quickly:
- What’s the recent trend of demand generation volume growth?
- What’s our sales team’s true capacity?
- Does seasonality affect the buyer journey?
- Have we built a strong pipeline of talent?
- Do we have the proper sales training infrastructure in place?
- How much sales rep attrition should we expect?
- How quickly are reps ramping?
- To break down the Bottoms Up Growth Model, we start with the sales lens.
The Sales Lens - When we think about projecting sales performance, we need to think about “Sales Capacity” - how many sellers do we have and what can they close predictably? This sets a baseline as to how much revenue we can close. Oftentimes, revenue targets are built based on the amount of revenue we think the team can close.
Let’s walk through an example. We closed $2M in ARR last year with 4 reps and each rep averaged $500K. So to triple and get to $6M we need to hire 8 new reps next month. Right?
Wrong. This is flawed for several reasons with specifically two fundamental factors missing: rep ramp time and rep attrition. Without considering these two metrics, it is dangerous to take historical sales performance and then project a similar level of success when increasing headcount. Let’s pause and think about all the moving pieces in a sales org that can hinder productivity.
-
Hiring: Finding and hiring qualified talent takes time. Do you use a recruiter? LinkedIn? Hiring isn’t easy.
-
Training: How quickly can a rep learn the product, buyer context, market landscape, and use cases?
-
Leads: Do they have enough leads or are they starting with nothing? This point we’ll emphasize below.
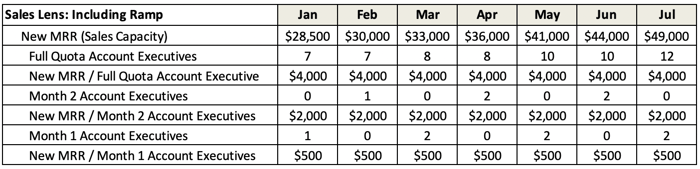
In our model, we factor in a 3-months-to-ramp cycle and the respective ARR quota. Remember, it is not reasonable to give credit to reps for full quota within the first or second month. So factor in ramp to accurately project sales capacity.
Sales Capacity - add up total rep quota production including ramping and ramped reps
Another key point is to factor in rep attrition. Rep turnover is around 30%, meaning of the 10 reps you expect to produce at full quota, only 7 will still be around in a year. So when building an accurate and predictable growth model, you should factor in attrition and we recommend modeling in one a quarter. Having an adjustment for rep attrition in your model will more closely reflect reality.
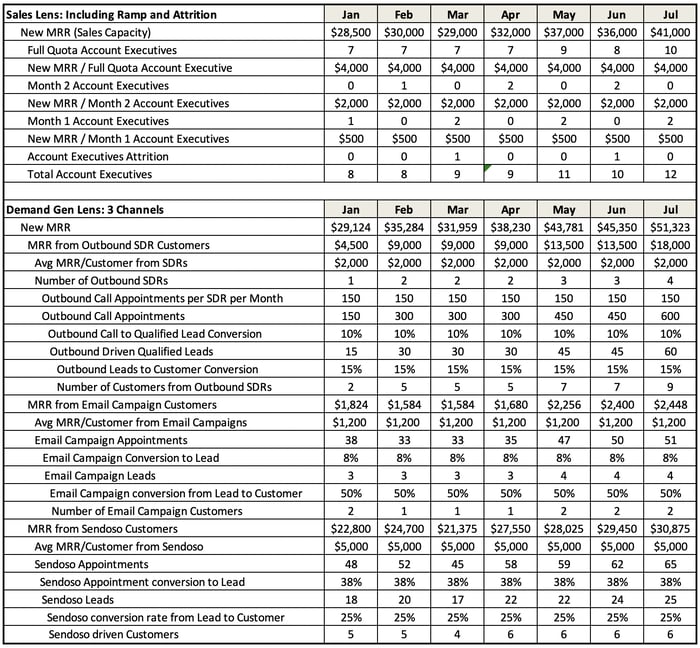
Sales lens with AE attrition included: a conservative estimate is to factor in 1 attrit per quarter
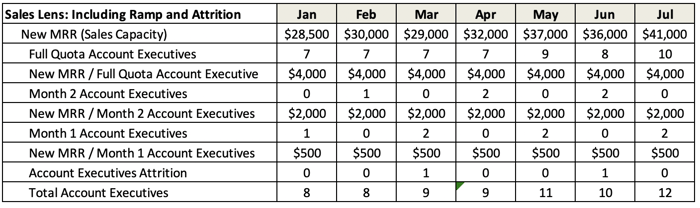
In our example, if you compare the 2 models before and after factoring in attrition, the sales team ended July with 12 reps without attrition and 10 with attrition. This is a meaningful difference in overall sales capacity. If not factored in, the ARR target can be difficult to hit and expectations unmet.
Given these two hurdles of ramp time and attrition, we recommend thinking about hiring as an absorption rate so you can absorb new reps and make them successful. So now that we have a quantitative sales capacity plan based on realistic assumptions, how do we know if our reps will have enough leads to hit their numbers? We need to look at the other side of the equation: demand generation.
The Demand Generation Lens - This lens looks at all revenue production attributed to each demand gen channel. This is slightly harder when companies do not yet have a strong handle on demand generation and marketing attribution. Here’s an example.
Let’s say you run an outbound SDR motion, email campaigns, and direct mail campaigns via our portfolio company Sendoso. Each month you run your different channels and each generates a certain number of leads. If you can’t attribute any leads to a channel, it makes forecasting difficult and might mean you need to redefine your measuring tactics. We will have another blog post on calculating sales efficiency and unit economics which are important in identifying which channels to invest in. Stay tuned for that.
Here is an example of the demand gen lens.
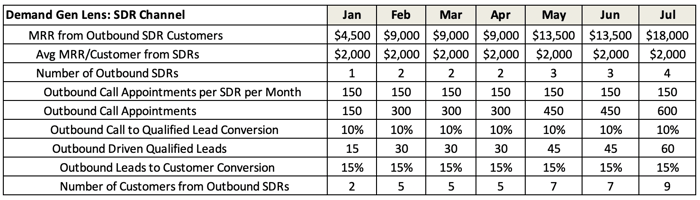
Starting with SDRs, we start with the number of reps we have and identify how many calls they are able to make a month. Let’s say each rep can make 150 calls a month, 10% convert to qualified leads, and 15% turn into customers. We can see what level of demand gen this channel is able to produce in terms of customer MRR. Keep in mind we should also factor in SDR ramp and attrition but for the purposes of this demand gen lens, we’ll ignore ramp and attrition.
Demand Gen Lens: SDR Channel
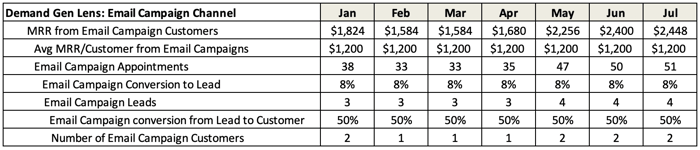
For email campaigns, let’s assume we start out with 38 appointments received. 8% turn into leads and 50% close. Track the MRR per month from the specific channel.
Demand Gen Lens: Email Campaign Channel
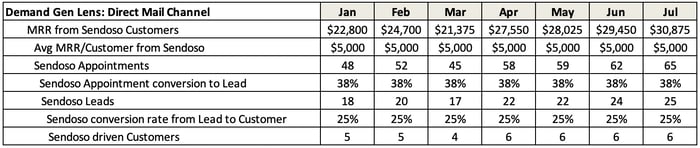
Same analysis goes for direct mail.
Demand Gen Lens: Direct Mail Channel
These tables show actual performance in terms of MRR production across all channels. We can analyze the breakdown of channel performance and look at the number of leads and conversion rates to reach a certain new MRR add. Why is this important? Two reasons: first, the granular view into performance can provide a signal as to what needs adjusting. What gets measured, gets managed. Second, we can start to piece together repeatable growth - historical data helps determine realistic future performance. From a VC perspective, we will underwrite an investment at a certain level of risk which decreases with greater predictability. This demand generation lens is critical in understanding the quality and quantity of lead flow to the AE team. It’s imperative that you’re able to measure this level of specificity of each demand gen channel on a monthly basis.
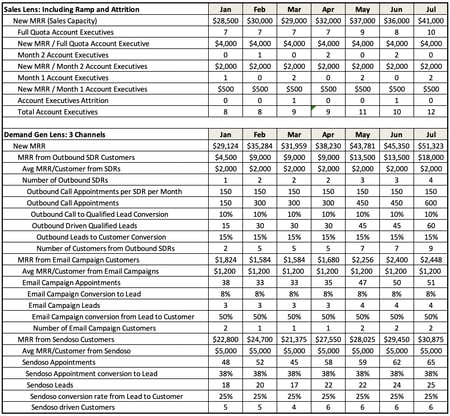
When we compare both our Sales Lens and Demand Generation Lens, we should see clear alignment around actual performance. We know how much sales “production” our AEs can close per month and how much demand gen comes from the marketing channels. When considering adjusting future growth plans, it’s best practice to hold around a 1.2x ratio of demand to sales capacity. For example, if you have a sales capacity (across ramping and ramped reps) of $50K of new MRR quota, then the demand gen contribution across all channels should have a target of $60K. If you’re under 1.0x or $50K, that means you don’t have enough leads to give to your reps. If it’s dramatically over at 2.0x or $100K, it means there are qualified opportunities on the table that likely won’t be engaged. 1.2x gives sales reps the ability to outperform and at the very least, hit their quotas. And if they don’t, you know it’s likely not a marketing problem but a sales problem. As you regularly update the Bottoms Up Growth Model, you should start observing if your demand gen channels are growing and how quickly. Top of funnel and conversion rates both impact what demand gen your sales reps have to close and therefore how quickly you can successfully bring on new reps. Use this gauge to determine the rep absorption rate we discussed above.
Here is what the full analysis should look like:
Combined Bottoms Up Growth Model - matching Sales Capacity with Demand Generation
As you can see from this breakdown, growth modeling takes patience and quantitative evaluation of the business and what it’s signaling. Without looking at sales capacity, factoring in ramp time and rep attrition, or weighing the demand gen lens, it’s hard to run a predictable revenue engine. As you rebuild your forecasts and go back to the drawing board, use these steps as a guide. Work through the sales capacity plan and remember to include both ramp time and rep attrition. Start a sequence to hire a rep a month assuming your demand gen can support it. Track demand gen to see if it’s on the rise and if your ratio passes 1.2x demand gen to sales capacity. From this analysis, you can start to visualize what ARR target your team can produce based on real numbers. Think about growth of the team as an absorption pace. Stay data-driven and use the Bottoms up Growth Model as your guide through this journey.
Download the Bottoms Up Growth Model here