
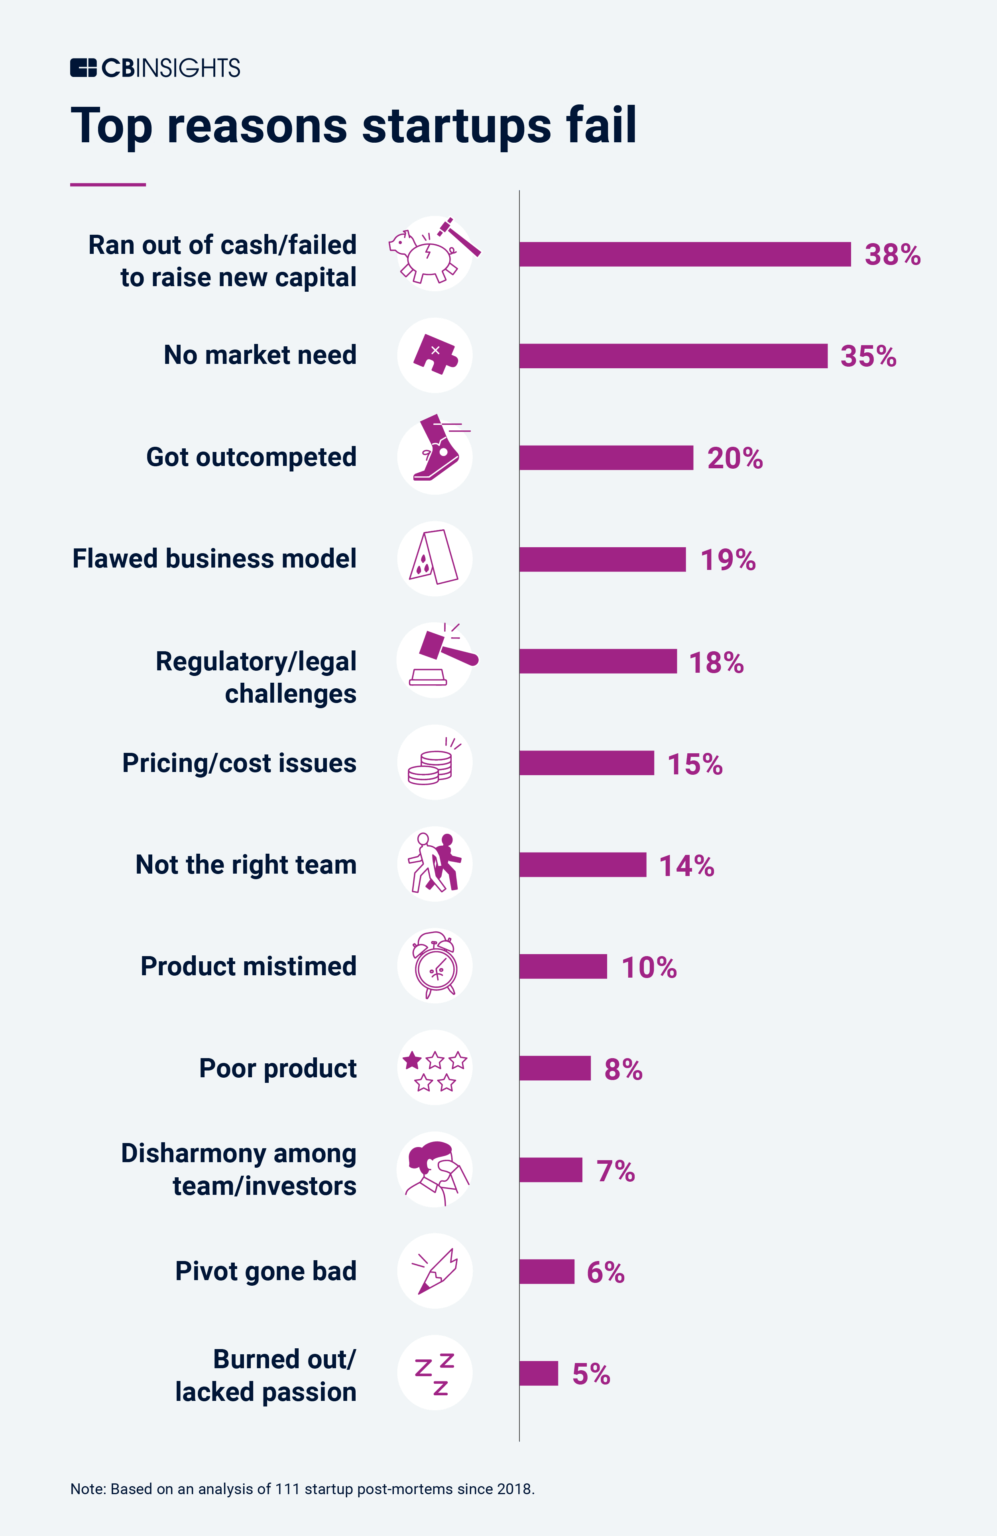
Why do most startups fail?
Sometimes it’s a product or market issue, or sometimes it’s an unforeseen circumstance like Covid-19. Still, 3 of the top 5 reasons involve go-to-market execution. You can’t execute on anything without a plan, which is where the disconnect begins for a lot of companies.
Most companies have a finance plan that includes the usual expectations for overall revenue growth, churn, gross margin, and expenses to drive projected unit economics and net burn.
With this, there are a few challenges using the finance plan to operationalize go-to-market presents:
- Most finance plans are a top-down approach, based on marketing spend / conversion or a % of revenue growth M/M.
- Conversion metrics and rep quotas are not based on actual results but goals without proven testing.
- Rep ramping and attrition are not accurately represented.
However, the biggest challenge with the finance plan is that it doesn’t show the pipeline metrics needed PER REP to hit the overall revenue number.
Why is this important?
Not only does it allow you to check that the per rep metrics are attainable (most mid market AE’s can’t do 5 demos a day!), it also gives sales leadership the key drivers that teams should focus on to hit the finance plan.
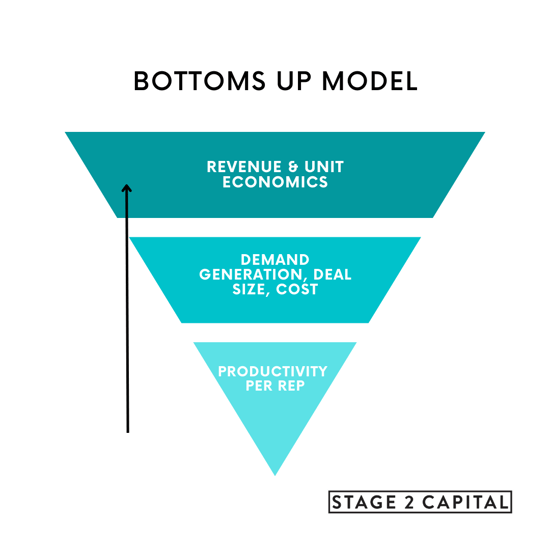
At Stage 2, we call these Leading Indicators of Unit Economics (LI of UE). The LI of UE illustrates the prospects / opportunities needed, not revenue, so that you can build a consistent process that aligns to market opportunity and optimizes for standard deal sizes, not whales. If reps are hitting these monthly metrics consistently, you should be on target to hit your Unit Economics goals, which are lagging indicators in the plan.
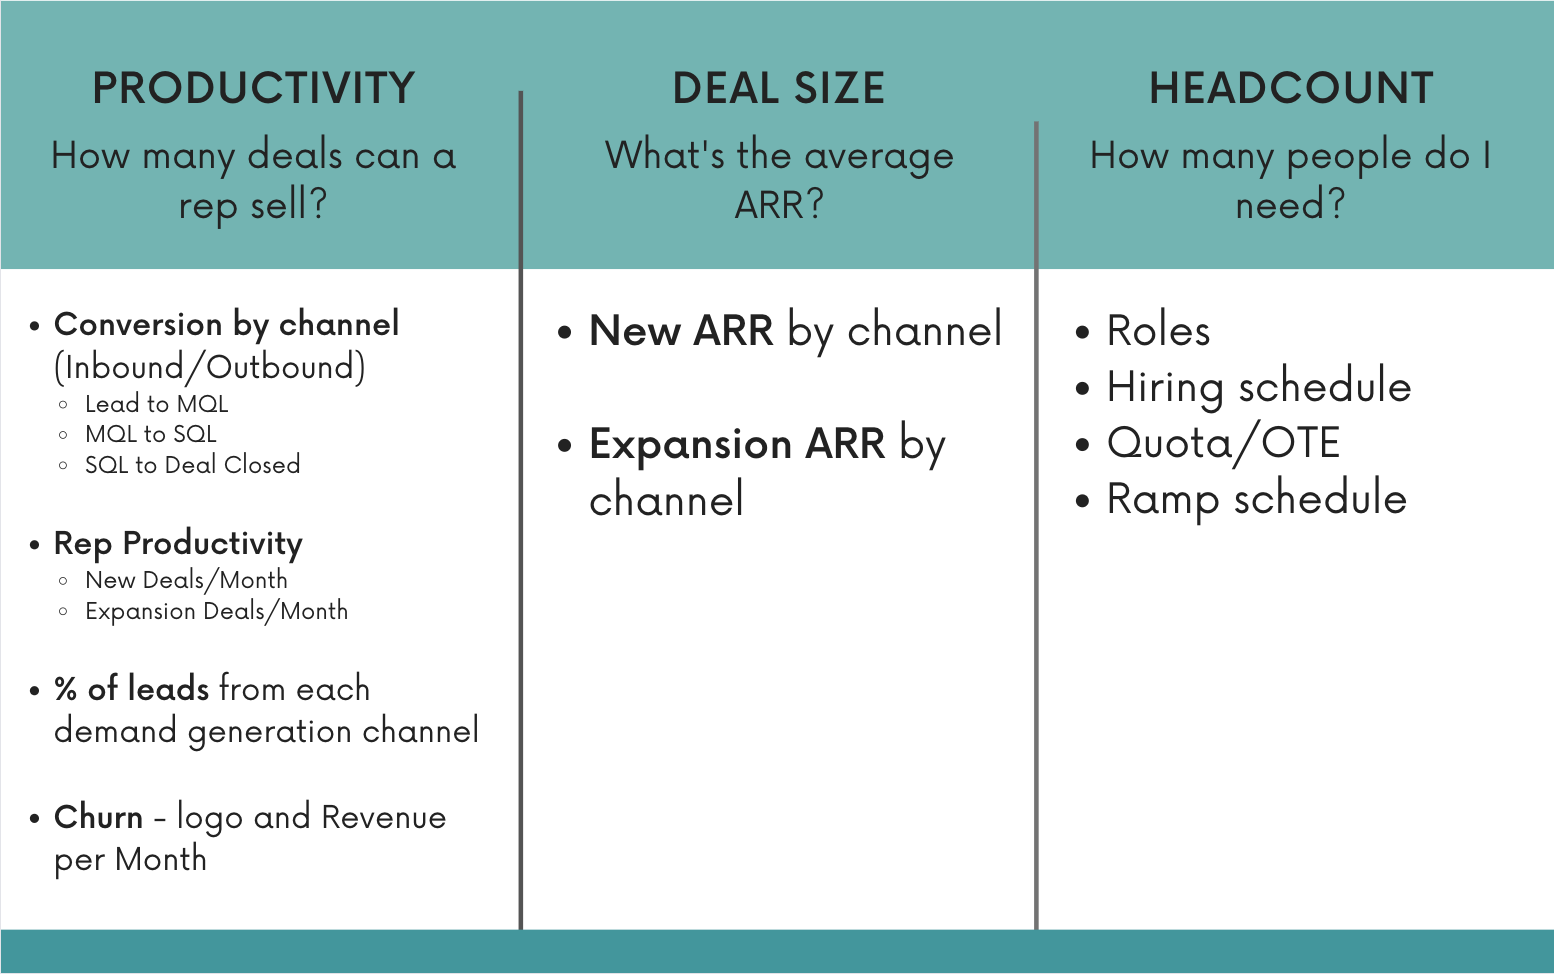
The Leading Indicators of Unit Economics are:
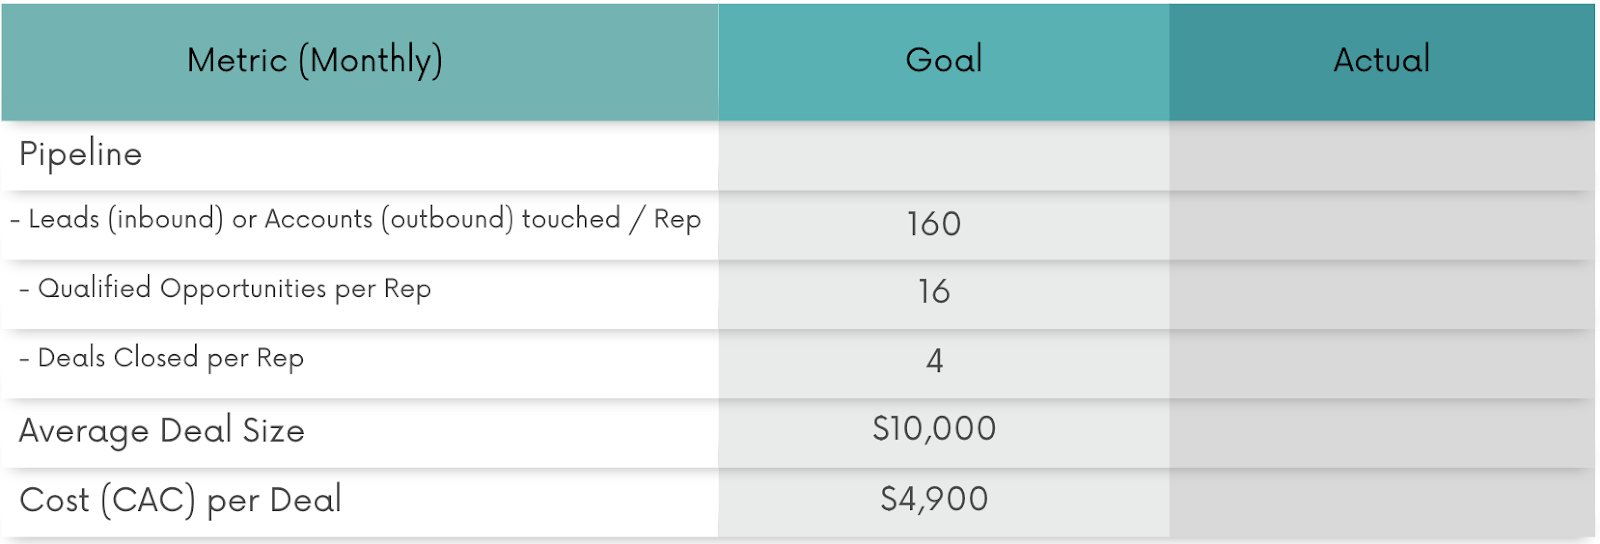
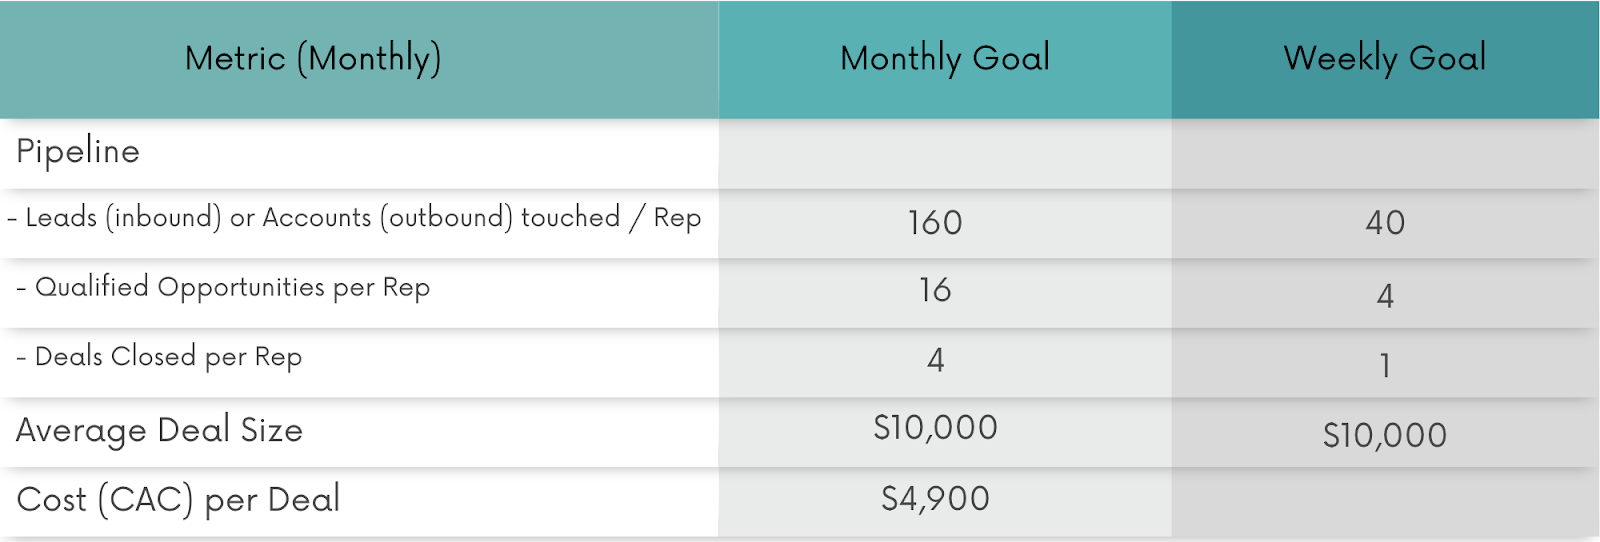
This example shows that an AE at this company needs to close 4 deals a month at $10,000 at a cost of $4,900 per deal. To do that, they need 16 qualified opportunities and 160 accounts to prospect with their outbound GTM strategy. Sales and Marketing can now agree on how they will generate accounts and opportunities, and the sales leader can measure how they are pacing towards these numbers on a daily basis.
In order to define your Leading Indicators of UE, you can use our GTM Bottoms Up Plan to get started.
The steps to building an ACHIEVABLE GTM Bottoms Up plan are:
1. Pull your actual results from the last 3-6 months for the key drivers in the plan
2. Build a Baseline Plan using your current results and headcount so you can see the revenue you will generate at your current steady state
- On the Model Assumptions tab, fill in the blue cells with the Actual Results data.
- On the GTM Bottoms Up Model, fill in the hiring plan at the top and headcount to the blue fields (make sure to include ramp up time by adjusting the headcount to a fraction of 1).
- Add in your finance plan revenue to compare the results.
3. Evaluate your baseline plan to determine A) is it realistic? B) What is the gap to the finance plan? You can then review with finance, marketing, customer success and the CEO to answer these questions:
- Is the pipeline / demand generation needed realistic based on your current demand generation channels? Does the cost align with your budget?
- Do marketing and sales agree on the demand generation plan in the model?
- Are the # of opportunities and deals per rep a month realistic?
- How does this impact your projected Unit Economics?
4. Agree on your Leading Indicators of Unit Economics
When you agree on your LI of UE across the company, you can use these in conjunction with your Leading Indicator of Retention as your gauge or speedometer to continue to invest in marketing and headcount. If you are hitting both your Leading Indicators of Unit Economics and Retention, keep hiring and investing. If you are missing one or both of your Leading Indicators, fix the problem before adding more expense that will throw your unit economics out of whack.
5. Create a Best Case plan to help you prioritize where you can improve and how you will test initiatives to drive that improvement.
The biggest mistakes companies make at this stage are adding AE headcount, increasing conversion rates or increasing pricing in the model to make the GTM plan match the finance plan. The challenge is that these changes are made without testing or having stable Leading Indicators. It’s fine to agree on where you should invest to drive improvements, but make sure you test first before you include it in the plan.
Here’s a cheat sheet for when you should add improvements or headcount into your GTM plan:

6. Operationalize your plan
What good is a plan if your entire team is not laser focused on hitting it?
If you write down your LI of UE on an excel sheet and then never revisit them, you are missing the entire point of building a GTM Bottoms Up plan. At any time, everyone on the GTM team should know how many deals a rep should sell a month, how many qualified opportunities they need, how many accounts or leads need to be touched, etc. Here are a few steps to ensure operationalizing is achieved:
- Review monthly with key stakeholders - There are two additional tabs in this model, the Sales & Marketing Details, and the Monthly Performance that will allow you to pull all the data together to see if you are tracking to your GTM Plan.
- Sales and Marketing Details - This tab drives a lot of the Monthly Performance tab, as well as allows you to see performance at a rep level.
- Monthly Performance - Once you add in the expansion and churn results, you can see how you are doing in both your LI of UE and your actual Unit Economics.
- Make it visible - People will gravitate towards where you shine the light, so aligning your team’s weekly and monthly reporting to the Leading Indicators of Unit Economics, and not just the pipeline, will ensure that you have consistency and focus. You can check out my Measuring What Matters blog on building this dashboard.
- Keep it focused - People can only concentrate on a few things at one time, so don’t give your team seven different items to track. The LI of UE makes it easy to keep your team focused by breaking tasks down into weekly goals that will drive the right outcome.
Here’s the LI of UE example I used earlier, but with a weekly breakdown. This AE now has a weekly actionable plan of starting outreach to 40 new accounts, holding enough discovery calls to get 4 qualified opportunities and closing 1 deal.
Another benefit of using LI of UE to drive pipeline is that it keeps AEs balanced on quantity AND quality so they are not relying on that one big revenue deal in their pipeline to close.
This is the process we use with new portfolio companies to develop their GTM strategy and Leading Indicators, as well as measure performance. Now you can use the GTM Bottoms Up Model as your cheat sheet to developing a plan for success in 2022 (and beyond).
If you have feedback, suggestions, or questions, please add to the comments or reach out directly.
Good luck!