
Should we re-establish growth and, if so, how fast?
This decision of when to scale and how fast has intrigued me over the years. Moving too quickly yields unnecessary burn of valuable capital assets, often leading to insolvency. Moving too slowly leaves the window open for competition to seize the opportunity before we do.
Despite the high stakes, it amazes me that these decisions are approached by management teams and boards with qualitative instincts rather than data-driven science. Over the last few years, I have worked with early stage ventures as an investor, operator, and board member to provide more rigor behind these decisions. The output of the work is summarized in the three phase sequential framework below.
The Science of Scaling Framework

The framework includes quantifiable milestones defining when phase achievement occurs…
The Science of Scaling Framework with quantifiable milestones

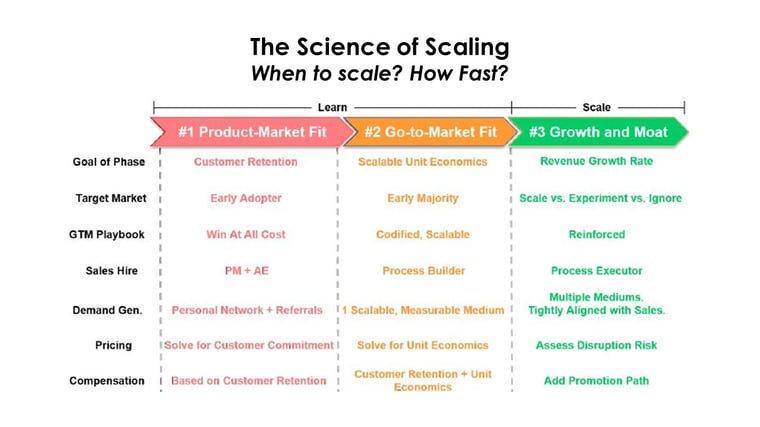
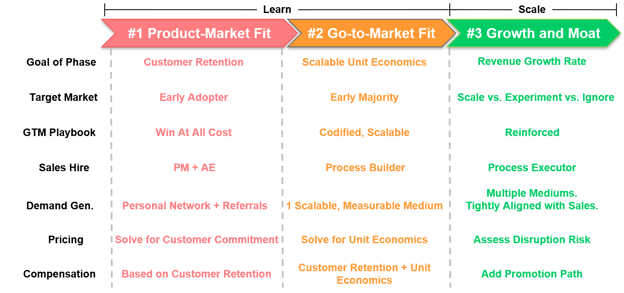
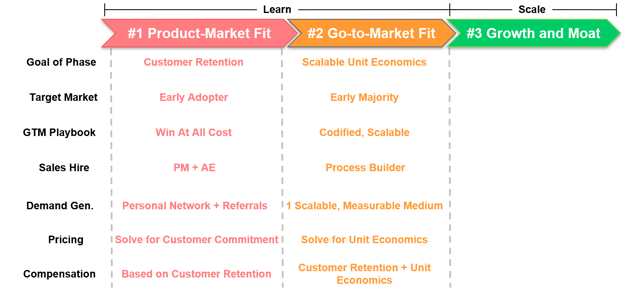
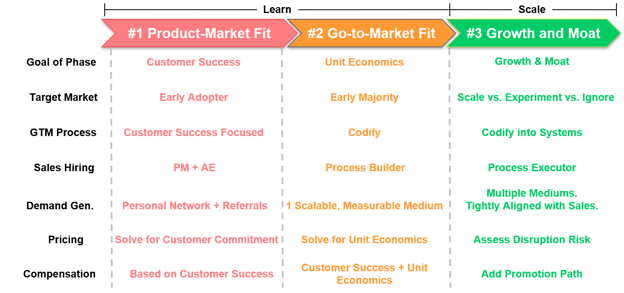
...and illustrates how key go-to-market decisions, such as price, hiring profiles, and sales process, evolve as progress is achieved.
The Science of Scaling Framework with quantifiable milestones and aligned GTM strategy
In this article, I elaborate on each sequential phase of the science of scaling framework.
Phase 1: Product-Market-Fit
“When we have product-market-fit.”
That is the response that almost every founder gives when asked “when should you scale?” The follow up question is more interesting.
“What is product-market-fit?”
I find it intriguing that for a term that is so well socialized throughout the entrepreneur ecosystem and so critical to determining when to scale, it has such a varied, non-rigorous definition. Well versed students reference Marc Andreessen’s definition, “being in a good market with a product that can satisfy that market”, but worry the definition leaves too much up to subjective interpretation, especially with regard to the words “good” and “satisfy”. Other astute students reference Sean Ellis’ quantitative approach of “at least 40% percent of surveyed customers indicating they would be "very disappointed" if they no longer had the product”. However, students referencing this approach worry that data gathered in a customer survey may be corrupted with false positive risk.
So, how can we take a more data-driven, scientific approach to product-market-fit?
I find “better-in-class” companies use long term customer retention as an indicator of product-market-fit. We may have heard the term “let the customer’s wallet do the talking”. The argument is a customer’s decision to renew or repeat purchase is the most factual, true positive indicator of their satisfaction with the product and, in turn, product-market-fit. In aggregate, the tech sector considers an annual customer retention rate above 90% to be the world class benchmark. Therefore, we can argue that companies have product-market-fit when annual customer retention exceeds 90%.
We are getting closer. I agree customer retention is the best statistical representation of product-market-fit. However, customer retention is a lagging indicator. It often takes quarters or even a year for companies to understand the true retention rate of customers that we acquire today. We do not have years or even quarters. Time and money, especially in an early stage setting, are not on our side. We need to test, learn, and iterate in much faster cycles.
For this reason, “best-in-class” startups use a leading indicator to customer retention to quantify product-market-fit. Some entrepreneurs in Silicon Valley refer to the leading indicator as the “ah-hah'' moment. If the leading indicator is objective, rather than subjective, and truly correlates with long term retention then we have defined a data-driven, time-sensitive approach to understanding product-market-fit.
Defining the leading indicator(s) of customer retention
Unfortunately, there is not a single leading indicator to customer retention definition universally applicable to all company contexts. However, the following definition framework is universally optimal.
[Customer Success Leading Indicator] is “True” if P% of customers achieve E event(s) within T time
Documented examples of leading indicators from modern day unicorns, organized in this format, are below.
- Slack: 70% of customers send 2,000+ team messages in the first 30 day
- Dropbox: 85% of customers upload 1 file in 1 folder on 1 device within 1 hour
- HubSpot: 80% of customers use 5 features out of the 25 features in the platform within 60 days
P is the percentage of customers that achieve the leading indicator. If P is surpassed, we have product-market-fit. But what is an acceptable P? Evaluating the extremes, 5% seems way too low. If we acquire customers and only 5% achieve our leading indicator of retention, that will be a terrible foundation for a business. At the same time, 95% seems way too high. The primary reason for this analysis is determining when to scale. Waiting until 95% of customers achieve the leading indicator seems too cautious, exposing us to the risk of waiting too long and missing the market opportunity or losing unnecessary ground to a competitor. A final consideration is the market’s perception of strong annual customer retention, which we previously mentioned is 90%. With all of these considerations, I often see P set at between 60% and 80%. I recommend the lower end of the spectrum if the company sells to small businesses and the higher end if the company sells to large businesses. Because we will instrument and continually monitor the metric on an on-going basis, I don’t believe that a debate on whether P should be 60% or 70% is productive. If we truly have found product-market-fit, we will find that the percentage continually improves even after we have moved to the next phase of scale.
E is the actual event or set of events that represents the leading indicator. Events around product setup, usage, and results are commonly used. E is the most important variable to think through. I recommend the following considerations when defining our leading indicator:
- Objective: The event should be factual and binary. It either happened or it didn’t. There is no subjectivity or room for interpretation. “Processed the first transaction” is objective. “Customer sees value” is not.
- Instrument-able: We need to be able to automate the measurement of the event. Later in the eBook we will demonstrate why it is important to continually measure the leading indicator as the company scales to assess whether product-market-fit is lost. Therefore, it will be important to instrument the measurement of the leading indicator prior to scale. “Logging in at least once per day” is instrumentable. “Mentions of the product in executive meetings” is not instrumentable.
- Aligned with customer success and/or value creation: Intuitively, creating customer value and success will lead to customer retention. Not doing so will lead to churn. Therefore, leading indicator events that represent customer value and success are recommended. “10% reduction in processing time” represents customer value. “Signed the contract” does not.
- Correlated to the company’s unique value proposition: The go-to-market team will be focused on driving leading indicator events in the new customer base. Marketing will be focused on driving awareness with segments where leading indicator achievement is easiest. Sales will be focused on convincing prospects that the leading indicator events are most important. The customer success team will be focusing on-boarding efforts on leading indicator event achievement. If those events are aligned with our unique value proposition, we will amass a customer base that is very sticky to our strategic positioning and very difficult for our competitors to disrupt. The leading indicator example for HubSpot provided earlier is a good example. HubSpot’s strategic positioning was “all-in-one”. Prospects could replicate the HubSpot offering by assembling a number of point solutions to create a broad marketing capability. Using only one feature within HubSpot’s platform was not optimal. There were better point solutions out there. HubSpot’s competitive advantage occurred when customers adopted many features within the HubSpot platform. Therefore, their leading indicator event of “5 or more features adopted” was aligned with their unique value proposition of “all-in-one”.
- Event combinations are OK but keep it simple: As the company expands its product, there may be multiple combinations of events that represent leading indicators of customer retention. These combinations can be “AND” or “OR” definitions. For example, remember Slack’s leading indicator of “2,000 team messages”. Well, 2,000 team messages exchanged between 100 people is likely far more adopted and valuable to the customer than 2,000 team messages between 2 people. Therefore, Slack may evolve their leading indicator to be “2,000 team messages AND 20+ users involved”. They may also find that integration with the CRM represents value and predicted retention. Therefore, they may again evolve the leading indicator to be “(2,000 team messages AND 20+ users involved) OR (2,000 team messages AND integration with CRM)”. As long as the combinations can be evaluated as a binary yes/no, it works. However, keep in mind there comes a cost with this complexity. One of the advantages of the leading indicator is it provides an easy to understand “north star” for the team during the product-market-fit stage. Complex combinations of leading indicators compromises the focus of front line GTM resources.
T is the time by which the leading indicator event is achieved. T should be as short as possible to maximize the pace of learning. However, it needs to be realistic. T often depends on how complicated it is to adopt our product and how long it takes to see value. Dropbox should have a very short T because it takes minutes to download, setup, and see value from the software. Dropbox’s T could arguably be hours. Workday should have a very long T. Workday sells broad, complex HR software into large organizations. It is not uncommon for the setup and user training process to take multiple quarters. Workday could have a T of 6 months or more. On average, T is set between 1 and 3 months for most software companies.
Identify product-market-fit early through customer acquisition cohorts
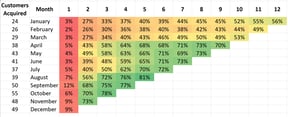
Once the customer retention leading indicator is defined, we should assemble a cohort chart illustrating the percentage of newly acquired customers that achieve the leading indicator over time. This approach maximizes the speed by which we can evaluate progress toward product-market-fit. Below is an example of a company measuring their leading indicator by monthly customer cohorts.
Percentage of customers achieving Customer Retention Early Indicator
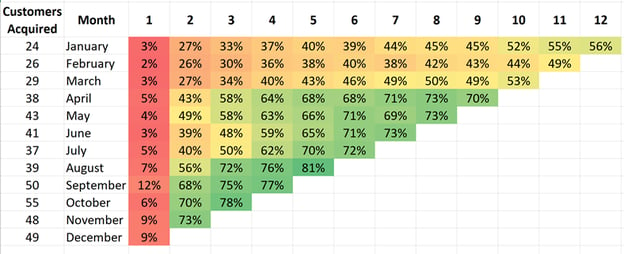
We can bring this chart to life using a fictitious company, TeleMed. TeleMed sells software to doctors enabling them to meet with patients over video rather than in-person. A well-designed customer retention leading indicator could be:
[Customer Success Leading Indicator] is “True” if 70% of customers conduct a video conference with a patient within 2 months.
Therefore, the chart tells us that the company acquired 24 new customers in January. After 1 month, 3% of those 24 customers had actually conducted a video conference with a patient. After 2 months, 27% of those 24 customers conducted a video conference with a patient. After 3 months, 33% of those 24 customers conducted a video conference with a patient. According to TeleMed’s definition of the customer success leading indicator, they had not achieved product-market-fit in the early part of this year. However, the company executed a number of adjustments, likely changes to the product, target customer, sales process, and on-boarding approach, and the situation has greatly improved. In October they acquired 55 new customers. After 1 month, only 6% of those 55 customers conducted a video conference with a patient. However, after 2 months, 70% conducted a video conference with a patient! The execution paid off. This company has achieved product-market-fit. We do not need to wait for long term retention to surface. This company is ready to proceed to the go-to-market stage.
Here are a few guidelines as we design our customer acquisition cohort analysis.
- In order to align all levels of the organization around product-market-fit pursuit, we recommend this chart be the first slide in the board deck, ahead of the P&L and top line revenue performance.
- The cohorts can be organized by daily, weekly, monthly, or quarterly time periods. Selecting the appropriate time metric is similar to defining the “T” factor in the customer retention leading indicator discussed earlier. A company like Dropbox should probably use daily customer acquisition cohorts and evaluate the cohorts’ progress toward the leading indicator on a daily basis. Workday should probably use quarterly customer acquisition cohorts and evaluate the cohorts’ progress toward the leading indicator on a quarterly basis.
- The “Customers Acquired” column are not cumulative numbers. These figures represent new customers acquired in that month.
- It is possible that the product usage within a cohort declines over time. Customers could dedicate their energy early on to using the product, find that the product is not useful, and stop using it. Companies need to instrument the cohort analysis to capture this behavior shift if it occurs.
- The time (T) of achieving the leading indicator is less important than continued improvement within the cohort over time. In the example above, we could argue transitioning to the go-to-market-fit stage in August even though the pure definition of product-market-fit had not been achieved yet. None of the prior cohorts have achieved 70% within 2 months. However, the prior cohorts were showing continued improvement month-over-month with the expectation that they would reach 70% and continue to rise. Furthermore, looking down the columns, recent cohorts at their 2 month and 3 month anniversary were substantially healthier than past cohorts at the same tenure.
The above cohort analysis does not work for early stage ventures selling 6-digit deals or higher to large enterprises. These ventures can surpass $1 million in revenue with less than 10 customers and may only acquire 1 or 2 new customers every quarter. Therefore, an alternative approach to evaluating the pursuit of product-market-fit is necessary.
In these situations, companies assemble a customer health card with a half dozen or so criteria. Common criteria fall into the following categories:
- Status on the technical setup and integration of the product
- Number of users that are activated and active
- Breadth of product usage
- Quantifiable value realization
- Executive sign off on reference-ability
The board literally reviews the “green”, “yellow”, “red” summary status for each company as well as the statuses of each of these criteria, especially for new customers and laggard deployments.
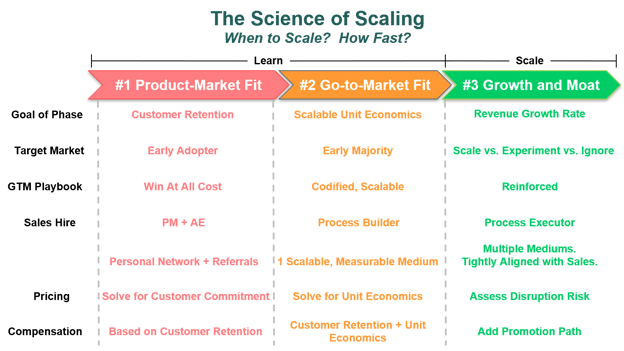
Aligning go-to-market execution with customer retention
With a more scientific definition of product-market-fit in place, the company has a precise “north star” to focus on. Most companies associate customer retention issues with deficiencies in product or customer on-boarding. However, I find a much different diagnosis. Most customer retention issues originate in sales and marketing. Customer retention is driven by the types of customers targeted by marketing and the expectations set during the sales process. Remember, the odds are against us at this early stage. Only 20% of Series A funded businesses will succeed. Best-in-class companies at this stage align all aspects of the go-to-market with the “north star” of the customer retention leading indicator. The chart below summarizes how.
Aligning Go-to-Market with Customer Retention
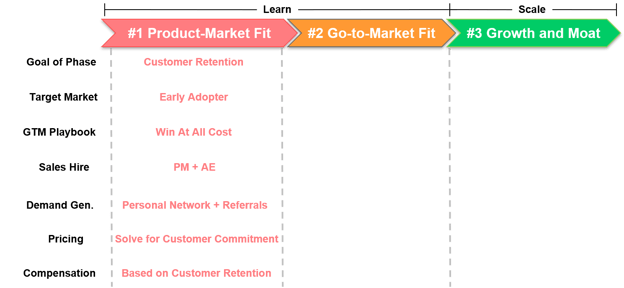
The first three components, target market, GTM playbook, and Sales Hire, are the most critical decisions at the Product-Market Fit stage. The buyers we choose to sell to as well as how we sell and on-board them will be the most important drivers of the customer retention leading indicator. A unique salesperson profile is needed to execute this early playbook. Scalable demand generation, pricing, and sales compensation are not important at this stage. If we are developing scalable cold calling campaigns, launching a tiered pricing model, or designing a robust sales compensation plan at this stage, we are not focused on the right things.
Download eBook: The Science of Scaling
A scientific, data-driven approach to two critical questions: When to scale? How fast?
Pages 10 to 13 in the Science of Scaling eBook elaborates on the key considerations behind these GTM decisions.
Verify the leading indicator of customer retention
As the company and customer base develops, we need to verify whether the leading indicator actually correlates with customer retention. In most cases, companies have moved on to the next phases before it is possible to verify this correlation. That is fine. However, it is important to conduct the analysis and continually conduct it in order to understand that the foundation is strong.
Below is an example verification for TeleMed, our fictitious doctor video company. As a reminder, TeleMed used:
[Customer Success Leading Indicator] is “True” if 70% of customers conduct a video conference with a patient within 2 months.
Correlate leading indicator to customer retention
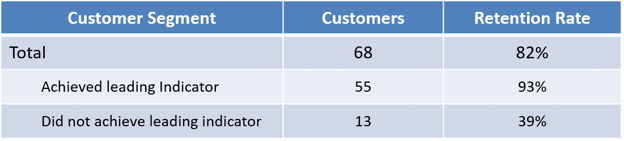 *All customers (churned and active) acquired between 12 and 18 months ago
In the above example, the company had acquired 68 customers between 12 and 18 months ago. Of the 68 customers, 56 are still customers for an overall retention rate of 82%. Of the 68 customers, 55 had achieved the customer retention leading indicator. In other words, 55 of the 68 customers conducted a video conference with a patient within the first 2 months. Of those 55 customers, 51 are still customers for a retention rate of 93%. Similarly, 13 of the 68 customers did not achieve the customer retention leading indicator. In other words, 13 of the 68 customers did not conduct a video conference with a patient within the first 2 months. Of those 13 customers, 5 are still customers for a retention rate of 39%. In this case, the leading indicator seems to predict long term retention well.
Correlate leading indicator to customer retention
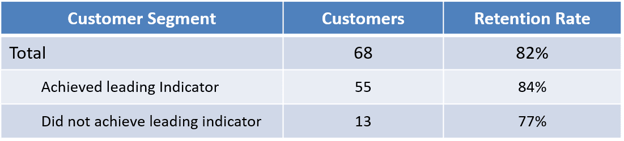 *All customers (churned and active) acquired between 12 and 18 months ago
The above example is similar to the prior one. The company had acquired 68 customers between 12 and 18 months ago. The overall retention rate was 82%. Of the 68 customers, 55 had achieved the customer retention leading indicator and 13 did not. However, in this case, only 84% of the customers that achieved the leading indicator are still customers and 77% of the customers that did not achieve the indicator are still customers. The leading indicator does not seem to predict long term retention well.
Recommendations for the verification analysis include:
- Limit the analysis to customers acquired between 12 and 18 months ago. Customers acquired before 12 months may have not had an opportunity to churn, especially if annual contracts are in place. Customers acquired more than 18 months ago are less representative of the current state of the go-to-market operations.
- Conduct the analysis quarterly, as the correlation may change as the market and product evolves.
- The verification analysis is not a prerequisite to moving to the go-to-market fit stage. Use the leading indicator to determine stage graduation.
- If we have historical customer data, analyze the correlation between our leading indicator hypothesis and long term retention now.
- Don’t worry if we didn't get the indicator correct. Focusing on these events, like setup or usage, probably didn’t hurt the business. Run other theories to see what events are actually correlating better and re-align the business with these events.
In the product-market fit phase, we demonstrated that we could acquire and retain customers consistently. Go-to-market fit means we can acquire and retain customers consistently and scalably. Part of scalability is ensuring we have a large enough target market to support our growth aspirations. The other part is, as we pursue that growth, we can do so in a profitable manner. In an early stage environment, it is advisable to measure profitability using unit economics rather than operating margin or EBITDA. Reason being that some of our costs increase with scale, which we often refer to as variable costs, while other costs remain relatively stable with scale, often called fixed costs. Unit economics allow us to extract out the fixed costs so we can more closely analyze how financially sustainable scale is for our business. Therefore, the quantifiable goal of the go-to-market fit phase is to prove the company’s ability to acquire and retain customers with strong unit economics.
The software industry currently rallies around three unit economic goals.
- LTV/CAC > 3
- Payback period < 12 months
- Magic Number > 1.0
These metrics provide a scientific, data-driven definition of go-to-market fit. However, we have the same issue that we encountered with customer retention in the product-market fit stage. Unit economics are lagging indicators. Like customer retention, it may take a year or more to assemble enough historical data to accurately calculate our company’s unit economics. Therefore, we need to understand the leading indicators of unit economics. We need to extract the long term unit economics target into short term go-to-market activity goals.
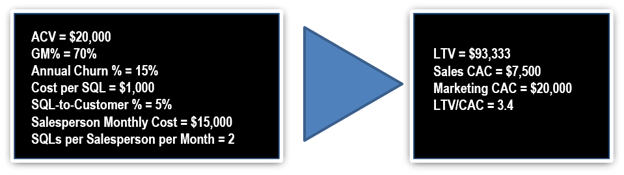
Below is an example of this approach using the LTV/CAC unit economics metric:
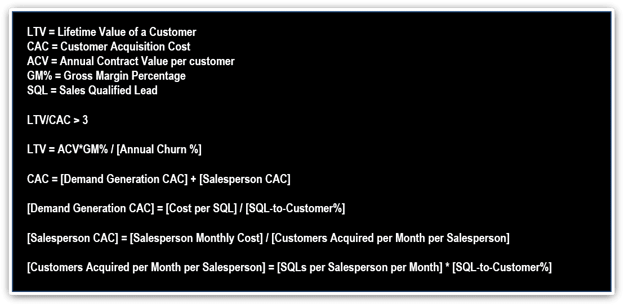
Through fairly simple algebra, we can express the long term goal of:
LTV/CAC > 3
...using near term activities:

For example, a company may have the following assumptions and results:
Similar to the leading indicator cohort analysis, we can now instrument the leading indicators into daily, weekly, or monthly activity charts to evaluate our progress toward go-to-market fit.
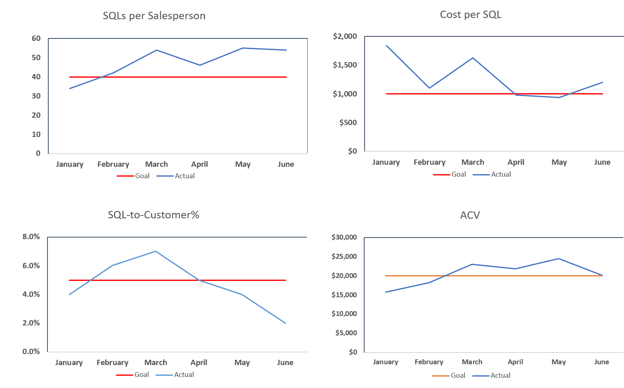
The dashboard above provides monthly, and potentially weekly, updates on how we are tracking against long term unit economics. We are in good shape if the blue line stays above the red line. A few considerations are as follows:
- The go-to-market fit formula had seven inputs. However, only four metrics are tracked in the above dashboard. Gross margin, customer retention, and cost per salesperson are not included. Customer retention is tracked using the customer cohort analysis designed in the product-market-fit phase. Cost per salesperson is relatively predictable and doesn’t need to be tracked. Gross margin is the more complicated metric. In many business models, acquiring customers profitably (CAC) has more uncertainty than on-boarding and servicing them (gross margin). This assumption is not always the case. However, it is typically the case. I would be far more optimistic about a company with strong customer acquisition metrics and mediocre gross margin than vice versa. Mediocre gross margin is often fixable with scale. Therefore, I recommend assuming around 70%, tracking it, and moving to the Growth and Moat stage even if gross margin is suboptimal.
- When estimating the salesperson monthly cost, include a buffer for sales management and to offset the added cost of ramping salespeople. Adding 25% to the direct cost of our salesperson is a good buffer.
- This analysis does not account for sales cycle and salesperson ramp time. These effects will have an impact on scalability and can be modeled during the growth stage to estimate the impact on cash flow.
- Notice the SQL-to-Customer% drop from April to June. This drop is common as the SQLs created in June have not gone through the necessary sales cycle yet. As those SQLs are closed in the months to come, the metric will improve. When assessing all of these metrics, the results from a few months ago are better estimates of the long term assumption than recent data points.
Align go-to-market execution with leading indicators of scalable unit economics
With a scientific, data-driven definition of go-to-market fit, we can now evolve our GTM decisions to align with this new “north star” for the organization. Similar to the prior phase, we need to evolve each component of the GTM strategy to achieve scalable unit economics while preserving customer retention.
Pages 20 to 29 in the Science of Scaling eBook elaborates on the considerations behind these GTM decisions.
Download eBook: The Science of Scaling
A scientific, data-driven approach to two critical questions: When to scale? How fast?
Phase 3: Growth and Moat
We now have established a more rigorous framework for the first question, “when to scale?”. In summary:
- We are ready to scale when we have product-market-fit and go-to-market fit
- We have product-market-fit when P% of customers achieve E event(s) within T days
- We have go-to-market fit when:
But what about the second question, “how fast”?
Our approach to initial scale is another common cause of Series A failure. All too often, once we decide it is time to scale, we hire a number of salespeople all at once. Usually this behavior occurs at the start of a fiscal year or right after a funding round. Pretty much every company I looked at over the past few years took this approach to scale at some point. I never really saw it work. I am sure successes are out there. I just haven’t seen it. Most of the time, these companies hired 10 salespeople in January and 2 were left at the end of the year.
When we stop and think about it, the reason for the massive rate of failure with this approach is somewhat obvious. We have not developed the prerequisite organizational capabilities to hire, on-board, feed, and manage that many salespeople at once. Let’s just reflect on the hiring piece for a minute. If a company decides to scale and establishes a plan to hire 10 salespeople next month, think about the new capabilities they need to find time for almost overnight. Think about how many in-person interviews are needed to land 10 great salespeople. Think about how many phone screens are needed. With the sudden surge of additional work on our already busy schedules, we rush through these efforts and make suboptimal hiring decisions. Furthermore, we don’t really know what we are looking for. We have never done it before. What if our hiring criteria are wrong? We have just multiplied an already expensive mistake by 10! That will probably kill our company.
For these reasons, we need to think about scale as a pace, not a single lump sum event. A best-in-class scale plan is not 10 salespeople next month and then see what happens. It is 2 salespeople a month for the next six months. If things break, we can stop and fix them. If they do not, we can go faster.
However, we still have not addressed the question “how fast?”.
Here is the answer. We should scale as fast as possible without losing product-market and go-to-market fit. Scale will compromise product-market and go-to-market fit. At this stage of our venture, the ten of us sitting around the office have figured out how to acquire customers, make them consistently successful, and do so in a profitable manner. However, can we now go out and acquire hundreds of employees over the next few years and teach them to do it? That is an even more difficult problem.
Therefore, we should scale as fast as possible without losing product-market and go-to-market fit. Fortunately, we know exactly how to measure product-market and go-to-market fit. In fact, we know how to measure leading indicators to inform us months in advance if these metrics look to be compromised. We use the leading indicator to customer retention chart we developed in the product-market-fit section and the leading indicator to scalable unit economics chart that we developed in the go-to-market fit section.
These two charts become our speedometer.

How fast should we scale? Establish a pace and watch the speedometer. If the speedometer breaks, slow down and fix the issue. If the speedometer looks good, accelerate. At the next board meeting, when our investors put pressure on us to scale as fast as possible, we can now come back to them with a predictable plan. “Our plan is to hire 2 salespeople a month for the next 6 months and monitor our leading indicators. If they are good, we will accelerate to 4 salespeople a month for 6 months. If they still look good after another 6 months, we will accelerate to 8, and so on.” Now we have a scientific, data-driven approach to scale.
Align go-to-market execution with the pursuit of growth
With growth comes a new set of risks. We mitigate these risks by aligning the components of our GTM strategy with growth.
Pages 31 to 44 in the Science of Scaling eBook elaborates on the considerations behind these GTM decisions.
Download eBook: The Science of Scaling
A scientific, data-driven approach to two critical questions: When to scale? How fast?
Conclusion
“When should we scale? How fast?”
This decision is so critical to startup execution and success. Yet, as an entrepreneur community we approach it with qualitative instincts rather than data-driven science. I hope this article has inspired an alternative approach.
It is important to note that I am not arguing for slower growth. I am encouraging healthier growth. While following these frameworks may yield a slower revenue outcome in the following quarter, they will lead to long term success faster and at a higher success rate.
Also keep in mind that I have only been iterating with this framework for about three years. Every discussion with an entrepreneur, I learn and codify further. In a way, it is simply an aggregation of what I have learned from all of you. The learning process is not over. I welcome feedback, positive and negative, so as an entrepreneurial community we can further demystify the science of scaling.
Download eBook: The Science of Scaling
A scientific, data-driven approach to two critical questions: When to scale? How fast?