
SaaS businesses dominated the tech IPO market over the past few years. Will Product-Led-Growth (PLG) businesses do the same in the coming decade?
I believe so.
I remember back to 2005 when many public equity investors were skeptical of the SaaS business model, citing doubt that public company CIOs would ever trust their data in the cloud. After a decade of category promotion and business model innovation, these SaaS-first organizations are dominating the public markets, generating what feels like a new unicorn every month and disrupting the past generation of tech behemoths.
The current state of PLG reminds me of SaaS in 2005. We have some early winners like Slack, Dropbox, and Asana. But skepticism exists in the later stage investor ecosystem. Entrepreneurs are scrambling to assess whether PLG is applicable to their venture and, if so, understand the best practices for optimal execution.
To itch my curiosity with this new go-to-market model, I created a new course this Spring at Harvard Business School titled “Decoding Growth in Silicon Valley”. Each week, I hosted a different growth leader in class to understand how growth worked at their respective organizations. My students and I heard from the growth teams at Pinterest, Facebook, LinkedIn, Lyft, Shopify, Tesla, Adidas, the NBA, and Disney+ and held workshops led by growth thought leaders Brian Balfour from Reforge and Sean Ellis, author of Hacking Growth.
One of the riddles we hoped to decode was whether the operating models of these high performing growth teams could shed light on the best practices of PLG execution in a B2B startup context. Therefore, we recruited a handful of B2B startups, forming student teams to apply the patterns we observed in the class to their PLG strategy.
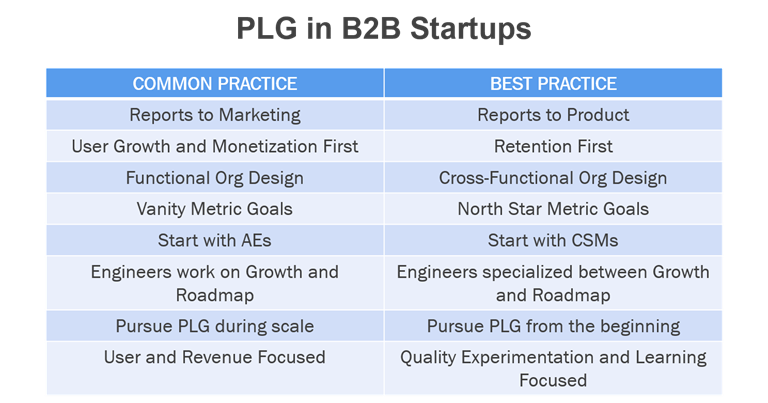
The following best practices emerged.
Define and Navigate Four Sequential North Star Metrics
Two interesting observations surfaced with regards to the metrics focus of the growth team. First, high performing growth teams focused on a single metric at a time, which they often referred to as the North Star Metric. Second, the North Star Metric evolved as the venture scaled. The sequence through which the metric evolved is illustrated and described below.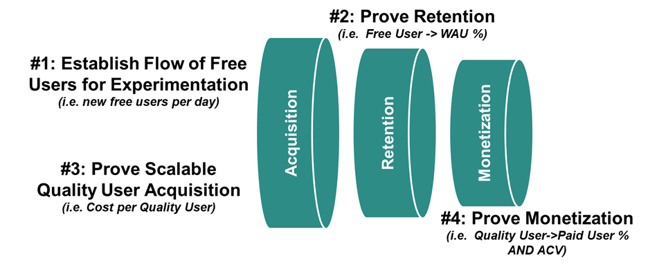
North Star Metric #1: Establish Flow of Free Users for Experimentation (i.e. new users per day)
Acquire enough users on a daily or weekly basis to enable a reasonable pace of experimentation, learning, and optimization. While the exact volume is unclear, more user flow per day is obviously better. More flow means more experiments and faster learning. Non-scalable tactics like paid digital marketing are often utilized here as the channel enables a fast path to visitors and some level of control and analysis of the types of visitors. The focus should not be on optimizing CAC or monetization. We are simply trying to create a reasonable flow of free users to conduct experiments with.
North Star Metric #2: Prove Free User Retention (i.e. New User->WAU%)
With a reasonable flow of new users each day, prove that the product consistently delivers on the value promise. We studied two approaches. I’d recommend using both of them.
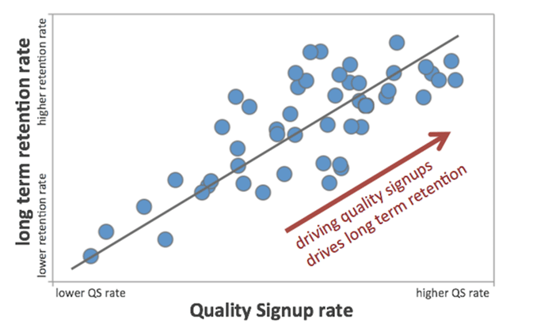
The first approach, from Brian Balfour, evaluates the usage retention of users, organized by acquisition date cohorts. The method starts with the definition of a usage retention metric. DAUs/WAUs/MAUs are common but other approaches customized to the unique value proposition of the business can be used. LinkedIn nicely summarizes in this article how they defined a “Quality Signup” as an immediately measurable metric that correlated nicely with long term usage retention.
 https://engineering.linkedin.com/blog/2017/06/the-science-of-quality-growth
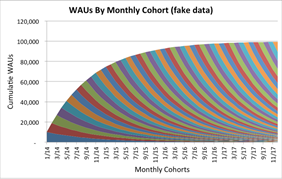
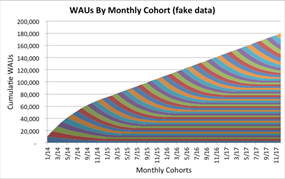
Following Balfour’s approach, the data is then organized into the model below, where each color represents a set of users acquired in a particular period, such as in the month of May, and the shape illustrates the percentage of those users that remain as free active users over time. If the retention of free active users eventually goes to zero, as shown in the chart on the left, growth will flat line. If the retention of free active usage levels out at a reasonable level, as shown on the right, growth will accelerate. The behavior in the chart on the right needs to be achieved before progressing the Step #3.
https://www.slideshare.net/tractionconf/the-holy-grail-of-traction-brian-balfour-hubspot
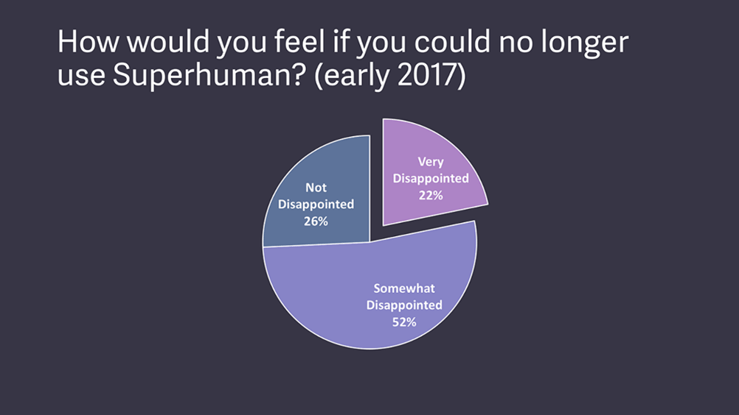
The second approach, from Sean Ellis, leverages a simple survey to assess the perceived importance of your product by the user. Ellis recommends asking users a simple question, “how would you feel if you could no longer use the product”, and provides three response options, Not Disappointed, Somewhat Disappointed, or Very Disappointed. Ellis recommends calling victory on this stage when 40% or more state they would be “Very Disappointed”.
In both cases, user segmentation is critical. The goal is not to achieve the stable free user retention or 40% “Very Disappointed” goal for all users. Instead, our goal is to achieve these metrics for a reasonably sized segment of the target user base. This segment is often referred to as Quality Users amongst growth teams and the Ideal Customer Profile (ICP) in B2B software companies. This article by FirstRound Capital about Superhuman is a brilliant description of how they used segmentation with Ellis’ approach to find their Quality User definition and claim victory on Step #2.
https://review.firstround.com/how-superhuman-built-an-engine-to-find-product-market-fit
North Star Metric #3: Prove Scalable Quality User Acquisition (i.e. Cost per Quality User)
With an understanding of the user segment where the product consistently delivers value, develop at least one scalable user acquisition channel that acquires Quality Users within the tolerable CAC target. You will need to make some assumptions on paid conversion rates and ACV to calculate the tolerable CAC target. Because low-cost channels are often needed here, virality and content marketing are two commonly used acquisition methods. Cold calling and paid digital marketing are rarely used.
North Star Metric #4: Prove Monetization (i.e. Quality User->Paid User% AND ACV)
Finally, with a clear definition of the users that retain with the product and a channel to acquire them scalably, focus on converting free users to paid customers.
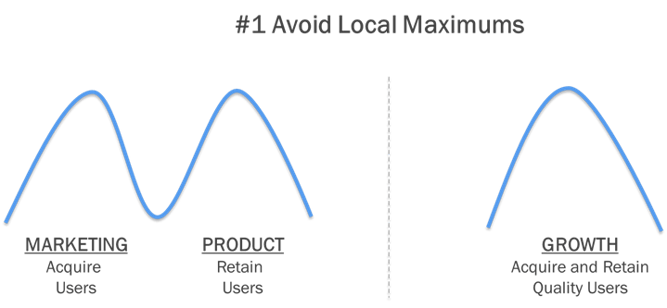
Establish a Cross-Functional Team Reporting into Product, not Marketing
High performing growth teams assembled a cross-functional team of product, engineering, and go-to-market resources. These teams consisted of the following capabilities.
- Product Managers: Receive input from the various constituents (team, users, product data, market data, competitive data) and drive prioritization of the experiment funnel.
- Full-Stack Engineers: Split time between executing the aspects of experiments that require back-end coding and develop the tools used by non-technical resources to execute experiments.
- Designers: Own the user interface and user experience of the product. Design ads, landing pages, in app messages, and other UI/UX elements used in experiments.
- Data Analysts: Evaluate the data and influence the product strategy and roadmap with observations.
- Marketers: Run user acquisition experiments, mostly focused on email campaigns, viral programs, and digital ads.
- CSMs: Serve as first line of support for inbound support chats or emails. Engage with users stuck in various stages of the funnel and communicate observation patterns to the team.Most B2B startups pursing PLG separate go-to-market
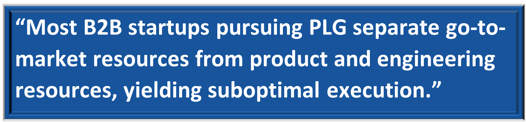 resources from product and engineering resources, yielding suboptimal execution. First, this siloed org design encourages the pursuit of local maximums. For example, go-to-market resources focus on acquiring as many users as possible and product and engineering focus on retaining as many of those users as possible. However, user retention is often strongly correlated to the quality of the users originally acquired. A cross-functional team can see this opportunity and work together toward a single goal of quality user acquisition and retention.
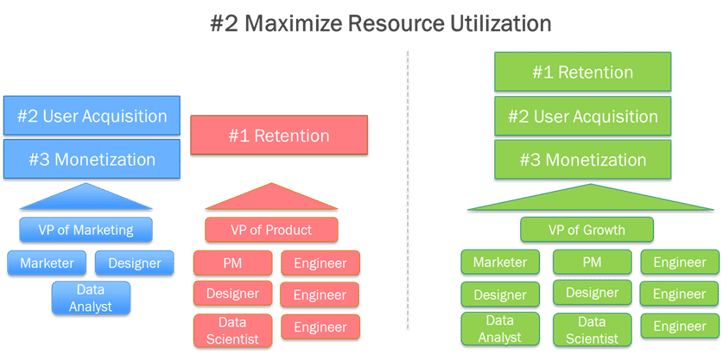
Second, a siloed organizational design restricts go-to-market resources to user acquisition and monetization tasks and product and engineering to user retention tasks. However, go-to-market resources can contribute to user retention and product and engineering can contribute to user acquisition and monetization. When these resources are organized cross-functionally, it enables the team to direct all resources at the current north star metric.
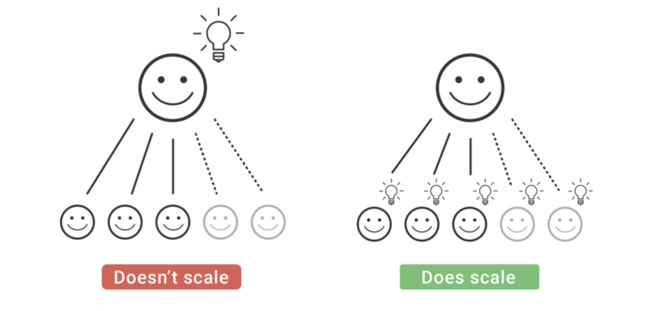
Transition growth team from “athletes” to “specialists” as the organization scales
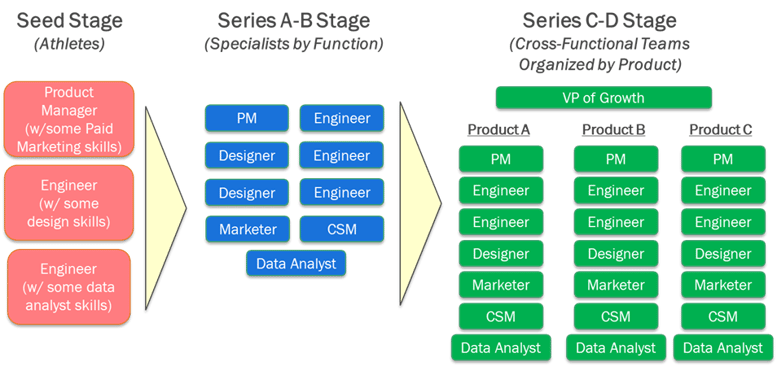
In a seed funded organization, there may only be two or three people on the growth team. Therefore, the company focuses on jack-of-all-trade athletes that are good at multiple capabilities, such as a strong engineer with above average design skills or a good product manager with adequate paid marketing abilities. As the organization and growth team scales, resources become more specialized to the function and eventually the buyer role or product type.
Specialize Product and Engineering as either Growth or Core Product
Best-in-class growth organizations specialized engineers as either core product engineers dedicated to the product road map or growth engineers dedicated to the growth funnel. This strategy eliminated a blocker to growth seen in other organizations where it is difficult to redistribute product and engineering resources away from the roadmap. The strategy is analogous to a resource specialization strategy we commonly see on the go-to-market side with SDRs, responsible for setting appointments, and AEs, responsible for converting the appointments to customers. B2B startups cannot implement this specialization at the seed stage due to resource limitations but by Series A should separate the organizations to avoid growth funnel deceleration. The model allows the executive team to drive the investment proportion of engineering investment across growth versus core product, rather than leaving this allocation decision up to the front line engineers who may not have the company’s holistic strategy top of mind.
Report Growth into Product, not Marketing
Of the teams we studied, the high performing growth teams reported into Product. The growth teams that suffered from growth blockers reported into Marketing. I have a hypothesis on why this was the case. When the growth team reported into marketing, engineers did not want to join the team because they didn’t want to work in marketing. Therefore, whenever the growth marketers needed to run an experiment or pursue an optimization that required engineering resources, which is quite often, they were expected to “influence” the engineers. Because product and engineering have more political power than marketing in most tech organizations, these marketers struggled to influence the engineers and restricted growth activities to top of funnel activities they could control. Positioning the growth team within the Product 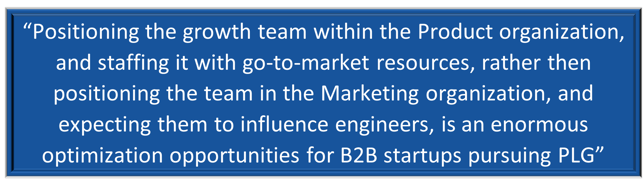 organization, and staffing it with go-to-market resources, rather then positioning the team in the Marketing organization, and expecting them to influence engineers, is an enormous optimization opportunities for B2B startups pursuing PLG.
Start with CSMs, Not Salespeople
Our natural tendency is to pass qualified accounts on to sales during or after product adoption occurs. However, sales will fall back into a sales-led-model, qualifying the prospect and trying to close the deal. This ruins the “adopt-before-buy” potential of PLG. If human-in-the-loop model is needed before adoption and monetization occurs, use a CSM profile, trained to understand the buyer needs and then show the buyer how to fulfill those needs in the product.
Compensate Salespeople More for Expansion Revenue than New Revenue
Once salespeople are added to the PLG funnel, compensate them more for expansion revenue. Traditional compensation plans pay salespeople more for first revenue from an account and less on expansion. In past business models, this approach made sense since it is harder to get your foot in the door than to leverage an existing relationship. However, this compensation design puts salespeople at odds with buyer preferences and the PLG model. In PLG, buyers want to adopt products with a single user or small team and once they see it work, expand it through the organization. A traditional compensation model that pays more for first revenue from an account causes the salespeople to want the organization to adopt the product companywide out of the gate. The seller and buyer are at odds with each other. The seller over-sells the consumption, seats go unused, the account fails to see the value to offset the expense, and an account that could have been a wonderful expansion opportunity ends up downgrading or churning. Compensating more for expansion revenue aligns the seller with the buyer and power of the PLG model.
Enable Rapid, High Quality Experimentation
Best in class growth teams run multiple experiments per day. Running experiments and applying successful findings across the growth funnel represents most of the growth teams’ work. While B2B startups will struggle to operationalize many experiments a day, they should aspire to run at least a few experiments per week. We observed the following best practices around experiment execution.
1. Hold the team accountable to properly defining the experiment up front. An example of a well-defined experiment is below.
__________________________________________________________
Action Item #3
Brief Description
When eSig users submit a signature request to a non-user, prompt the non-user to create an eSig account.
Owner: Dennis Flacke
Supporting Resources: Christine Khemmich for design support
Business Goal: Increase user acquisition through a scalable, cost efficient viral marketing program.
Hypothesis: This test will be our first non-incentive viral experiment. We hope the quality of users will be higher since there is no potential social pressure from an existing user to join and there should be no fake user risk. Also, with no on-going cost for the program, there is low bar to the volume of users needed from the campaign to justify keeping it active. We expect average volume with high activation and MAU retention rates.
Experiment Design: When a non-user receives a signature request from an eSig user and executes the signature, prompt the non-user with an offer to sign up to eSig for free.
Aggregate the results into the Sharelink medium on our growth dashboard but instrument the test so that the users acquired through this experiment can be identified separate from other experiments that are also aggregated into the Sharelink medium.
Success Metrics: A volume of users that elevates the current user contribution of the Sharelink medium and, in turn, the viral coefficient of eSig combined with high activation rates and MAU retention rates.
Experiment Limitations: Although we have heard that our competitors saw sizeable returns from this viral design, our research has shown that we struggle to create value for signature requestors versus signers. Therefore, we may have limited opportunities here, especially compared to our competition.
We also run the risk that existing users get upset that we promote eSig to their contacts without their permission.
Results
- Test ran from 6/20 to 6/30. Results delivered on July 1st, 2015
- There were 2,137 signatures executed by non-users during the test period.
- See “eSig - Growth Action Items 2-4 Results - 2015-06”
Insights: Exciting performance. User creation volume was low but the test was only run for 1/3 of the month. For the first time, we saw activation rates and MAU retention rates much higher than the average in the Sharelink medium and on-par with other high performing mediums.
Next Steps
- Run for a full month
- Optimize the CTA and sign up form
- Should we explore if we can get more users to request signatures?
__________________________________________________________
- Setup a weekly call to review the outcomes of last week’s experiments, discuss learnings, and discuss ideas for the next set of experiments. John Egan from Pinterest encourages a bottoms up idea generation model in this article. Startups can encourage everyone in the company to contribute to the idea generation phase. Doing so creates exposure to the customer that will lead to different and valuable perspectives.
 https://jwegan.com/growth-hacking/pinterest-supercharged-growth-team-experiment-idea-review/
- Maintain an experiment log. Not only does the log force the team to think through and document the key learnings, it also provides the best training manual for new resources joining the team to immediately come up to speed on the knowledge of the team.
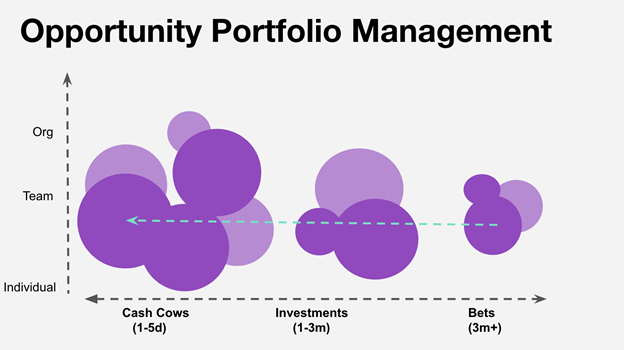
- Balance Quick Wins with Big Bets. Here is how Ludo Antonov at Lyft thinks about this balance.
 https://www.kieranflanagan.io/blog/the-growth-os-used-by-companies-like-pinterest-and-lyft
- Invest R&D in making experimentation easy across the organization. The top performing growth teams we studied invested over 50% of their R&D effort in developing tools to make experimentation easy. This is a best practice not well understood outside of growth. What is a better use of engineering time, having an engineer implement two in-app notifications to test out or having an engineer develop the infrastructure so that non-technical resources can test any type of in-app messaging without needing to access the code? Clearly the latter is better. If you find your engineering resources dedicating lots of time implementing tools or architecting your product to enable non-technical resources to run rapid, high quality experiments, you are on the right track.
Strategic Considerations of PLG
The Hidden Power of PLG: Sustainable Moat Development
PLG presents an opportunity that is rare in B2B software, the creation of a sustainable moat. In traditional software, we build a product, hope that it takes off, and increase our prices as the brand and category matures. However, we are always at risk of a group of talented engineers in Silicon Valley disrupting us with a similar product offered at a lower price. My sustainable moat test is the following question: “Imagine a talented group of engineers formed a team, raised a big round from Sequoia, reverse engineered your product, and charged half your price. Why do you still win?” PLG presents a disruptive business model advantage for the attacker and substantially decreases disruptive risk for the defender. It’s very difficult to undercut price if the opening use case costs $0. By the time the user’s economic buyer gets involved, the selling organization has created tremendous switching costs. For example, Box could walk into the CTO of Fidelity’s office checking off the CTO’s needs of geographic redundancy and role permissions. But Dropbox could walk in and say “30,000 of your employees use our product every day. We just want to help you secure the usage to meet Fidelity’s standards”. PLG organizations also benefit from economies of scale. PLG provides R&D teams with tremendous user volume to experiment, learn, and iterate product features and user experiences.
If PLG is possible in your category and you do not pursue it, someone else can. Unless the defending company has created a true sustainable advantage, or “moat”, then there will be a forever risk of disruption. For these reasons, I encourage startups to explore the applicability of PLG to their category.
Early Focus on PLG Increases the Likelihood of Product-Market-Fit
Many B2B startups jump prematurely to defining revenue as the organization’s north star before proving the product consistently generates value for the target customer. A PLG go-to-market model puts product value at the forefront of the organization’s focus, increasing the likelihood of PMF as a precursor to scale.
PLG is Very Difficult to Implement After Scale
There are a number of unicorns who have implemented PLG out of the gate and then layered an enterprise team on later (i.e. Dropbox, Asana, Slack, etc.). However, while I can think of many companies that tried to add PLG after reaching $10M in ARR through a sales-led model, I can’t think of anyone that succeeded. The reasons for failure in these situations are twofold:
- Unwillingness for the organization to put enough value into the free version of the product for fear of cannibalizing the current revenue stream.
- Poor selection of an optimal temporary “sandbox” for the growth team to experiment and learn in while minimizing impact to the core business model.
The key takeaway: time is of the essence. If you are at the seed stage, think twice about waiting until you hit a few million in ARR before attempting PLG. The odds of success become significantly lower at that point. It should also be comforting that if you attempt PLG and find that it is not feasible in your category, you are left with a very easy to adopt product and an extremely low friction user acquisition funnel. That’s a pretty good foundation to transition to a sales-led growth model.
Category Attributes Favorable to PLG
The following venture contexts make PLG a more likely business model:
#1: Low time and effort to retainable value
- Low time: Users see the value in minutes
- Low effort: Users realize the value with little work on their part
- Retainable value: The value use case is on-going rather than one-time.
#2: A value proposition that has current demand versus one that needs to be evangelized
#3: Potential for virality
- I’m not convinced PLG needs virality. PLG needs a low cost acquisition medium, one of which can be virality
- Organic virality is more powerful than incented virality. Organic virality exists if the virality occurs through the normal usage of the product (i.e. when a Docusign user sends a signature request to a non-user).
- Virality is more powerful when the viral behavior transcends corporate boundaries versus if it is limited to within the company (i.e. Calendly).
#4: Large, horizontal market
PLG Playbook for B2B Startups - Summarized