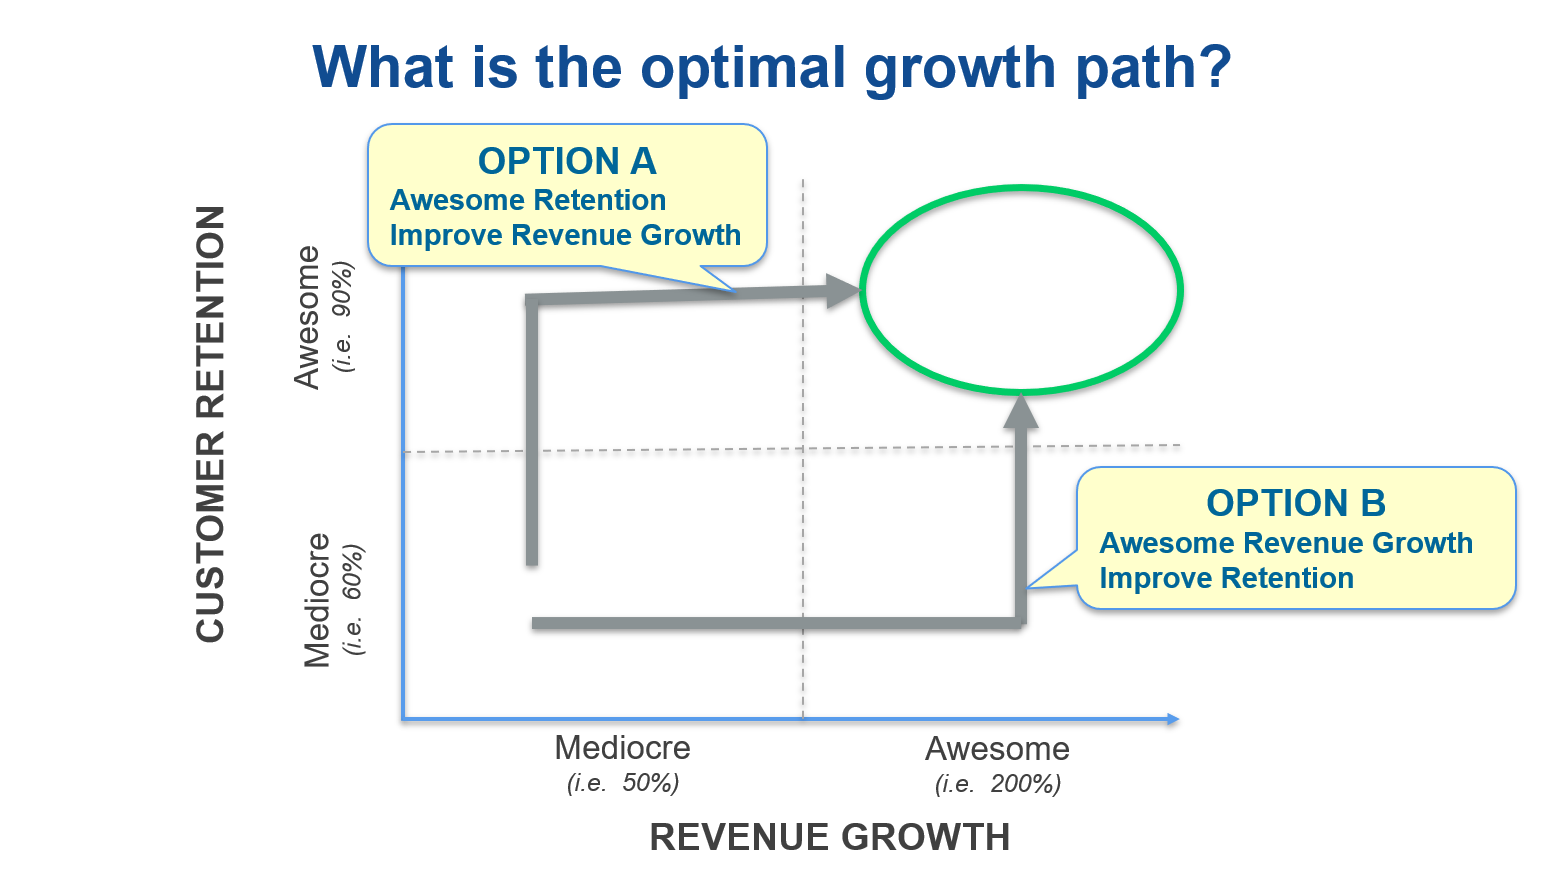
Look at the diagram below. The upper right is optimal. It represents exceptional revenue growth and exceptional customer retention. However, if you had to choose between path A or B, which would you prefer?
I posed this question at the 2019 Annual SaaStr Conference in Silicon Valley. The audience almost unanimously chose Option A.
I called B.S. I agree with the choice. I don’t agree that, as entrepreneurs, we follow it.
%20every%20T%20time%20(1).png?width=352&name=north%20star%20quote%5BCustomer%20Success%20Leading%20Indicator%5D%20is%20%E2%80%9CTrue%E2%80%9D%20if%20P%25%20of%20customers%20achieve%20E%20event(s)%20every%20T%20time%20(1).png)
Why? As entrepreneurs, the first metric we mention when describing our business is revenue. As investors, the first question we ask is about revenue growth. In board meetings, the first slide shown illustrates revenue. “Triple. Triple. Double. Double.” This phrase, meaning triple revenue in year one and two, then double revenue in year three and four, is the perceived blueprint for future unicorn status. We don’t prioritize customer retention. We are obsessed with revenue growth as a first north star metric. And it’s killing our businesses.
I agree that product-market-fit is the first major milestone for a
seed stage business to pursue. However, a revenue target such as
$500K ARR is not a good representation of product-market-fit.
The ability to convince customers to give you money represents market-message fit. I can get really good at convincing eskimos to buy ice, but it doesn’t mean they actually need it or the product creates value for them.
So how should we quantify product-market-fit?
The metric that best measures product-market-fit is customer retention. A customer’s decision to renew or repeat purchase is the most factual, true positive indicator of their satisfaction with the product and, in turn, product-market-fit. In aggregate, the tech sector considers an annual customer retention rate above 90% to be the world class benchmark. Therefore, we can argue that companies have product-market-fit when annual customer retention exceeds 90%.

%20every%20T%20time-png.png?width=352&name=north%20star%20quote%5BCustomer%20Success%20Leading%20Indicator%5D%20is%20%E2%80%9CTrue%E2%80%9D%20if%20P%25%20of%20customers%20achieve%20E%20event(s)%20every%20T%20time-png.png)
However, customer retention is a lagging indicator. It often takes quarters or even a year for companies to understand the true retention rate of customers that we acquire today. We do not
have years or even quarters. Time and money, especially in an
early stage setting, are not on our side. We need to test, learn,
and iterate in much faster cycles.
Therefore seed startups need to define a leading indicator of customer retention to quantify product-market-fit. Some entrepreneurs in Silicon Valley refer to the leading indicator as the “ah-hah'' moment. If the leading indicator is objective, rather than subjective, and truly correlates with long term retention then we have defined a data-driven, time-sensitive approach to understanding product-market-fit.
Unfortunately, there is not a single leading indicator of customer retention definition universally applicable to all company contexts. However, the following definition framework is universally optimal.
[Customer Success Leading Indicator] is “True” if P% of customers achieve E event(s) every T time
Documented examples of leading indicators from modern day unicorns, organized in this format, are below.
- Slack: 70% of customers send 2,000+ team messages every month
- Dropbox: 85% of customers backup their files every day
- HubSpot: 80% of customers use 5 features out of the 25 features in the platform every month
We have deduced the question of product-market-fit to the values of P, E, and T. Below are best practices on defining these variables for our business.
P is the percentage of customers that achieve the leading indicator. If P is surpassed, we have product-market-fit. But what is an acceptable P? Evaluating the extremes, 5% seems way too low. If we acquire customers and only 5% achieve our leading indicator of retention, that will be a terrible foundation for a business. At the same time, 95% seems way too high. The primary reason for this analysis is determining when to scale. Waiting until 95% of customers achieve the leading indicator seems too cautious, exposing us to the risk of waiting too long and missing the market opportunity or losing unnecessary ground to a competitor. A final consideration is the market’s perception of strong annual customer retention, which we previously mentioned is 90%. With all of these considerations, I often see P set at between 60% and 80%. I recommend the lower end of the spectrum if the company sells to small businesses and the higher end if the company sells to large businesses. Because we will instrument and continually monitor the metric on an on-going basis, I don’t believe that a debate on whether P should be 60% or 70% is productive. If we truly have found product-market-fit, we will find that the percentage continually improves even after we have moved to the next phase of scale.
E is the actual event or set of events that represents the leading indicator. Events around product setup, usage, and results are commonly used. E is the most important variable to think through. I recommend the following considerations when defining our leading indicator:
- Objective: The event should be factual and binary. It either happened or it didn’t. There is no subjectivity or room for interpretation. “Processed the first transaction” is objective. “Customer sees value” is not.
- Instrument-able: We need to be able to automate the measurement of the event. In our Science of Scaling eBook, we demonstrate why it is important to continually measure the leading indicator as the company scales to assess whether product-market-fit is lost. Therefore, it will be important to instrument the measurement of the leading indicator prior to scale. “Logging in at least once per day” is instrumentable. “Mentions of the product in executive meetings” is not instrumentable.
- Aligned with customer success and/or value creation: Intuitively, creating customer value and success will lead to customer retention. Not doing so will lead to churn. Therefore, leading indicator events that represent customer value and success are recommended. “10% reduction in processing time” represents customer value. “Signed the contract” does not.
- Correlated to the company’s unique value proposition: The go-to-market team will be focused on driving leading indicator events in the new customer base. Marketing will be focused on driving awareness with segments where leading indicator achievement is easiest. Sales will be focused on convincing prospects that the leading indicator events are most important. The customer success team will be focusing on-boarding efforts on leading indicator event achievement. If those events are aligned with our unique value proposition, we will amass a customer base that is very sticky to our strategic positioning and very difficult for our competitors to disrupt. The leading indicator example for HubSpot provided earlier is a good example. HubSpot’s strategic positioning was “all-in-one”. Prospects could replicate the HubSpot offering by assembling a number of point solutions to create a broad marketing capability. Using only one feature within HubSpot’s platform was not optimal. There were better point solutions out there. HubSpot’s competitive advantage occurred when customers adopted many features within the HubSpot platform. Therefore, their leading indicator event of “5 or more features adopted” was aligned with their unique value proposition of “all-in-one”.
- Event combinations are OK but keep it simple: As the company expands its product, there may be multiple combinations of events that represent leading indicators of customer retention. These combinations can be “AND” or “OR” definitions. For example, remember Slack’s leading indicator of “2,000 team messages”. Well, 2,000 team messages exchanged between 100 people is likely far more adopted and valuable to the customer than 2,000 team messages between 2 people. Therefore, Slack may evolve their leading indicator to be “2,000 team messages AND 20+ users involved”. They may also find that integration with the CRM represents value and predicted retention. Therefore, they may again evolve the leading indicator to be “(2,000 team messages AND 20+ users involved) OR (2,000 team messages AND integration with CRM)”. As long as the combinations can be evaluated as a binary yes/no, it works. However, keep in mind there comes a cost with this complexity. One of the advantages of the leading indicator is it provides an easy to understand “north star” for the team during the product-market-fit stage. Complex combinations of leading indicators compromises the focus of front line GTM resources.
T is the time by which the leading indicator event is achieved. T should be as short as possible to maximize the pace of learning. However, it needs to be realistic. T often depends on how complicated it is to adopt our product and how long it takes to see value. Dropbox should have a very short T because it takes minutes to download, setup, and see value from the software. Dropbox’s T could arguably be hours. Workday should have a very long T. Workday sells broad, complex HR software into large organizations.
It is not uncommon for the setup and user training process to
take multiple quarters. Workday could have a T of 6 months or more. On average, T is set between 1 and 3 months for most software companies.
Hopefully, the structure above provides guidance on how to define your Leading Indicator of Retention. Often entrepreneurs overcomplicate the decision. My advice is keep it simple and
make a quick decision. Even product setup is fine. Remember,
95% of your peers are choosing revenue as their north star
metric. As long as you select a metric representative of
customer usage, engagement, and/or value, you are in the
top 5% of executors at this stage.
So what is your Leading Indicator of Retention? Feel free to put your hypothesis in the comments and I’ll do my best to respond.