
How do venture capitalists think about churn?
For the most part, they use a KPI scorecard like the one below: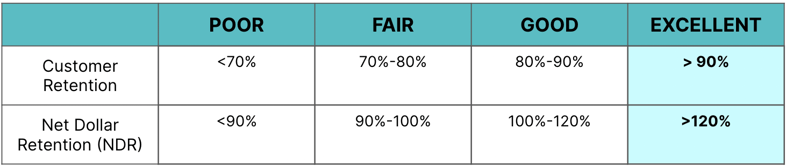
However, if a startup’s customer retention is off the mark, even significantly, they can still position the company as an attractive investment. This article outlines the strategy, execution details, and resulting investor narrative needed to do so.
Let’s begin with a reality check. Startups rarely yield exceptional customer retention metrics out of the gate. Under most circumstances, an entrepreneur will form hypotheses on the customer segments that are most likely to buy, and have success, with the envisioned product. They then spend the first year selling and onboarding customers from a variety of these promising segments.
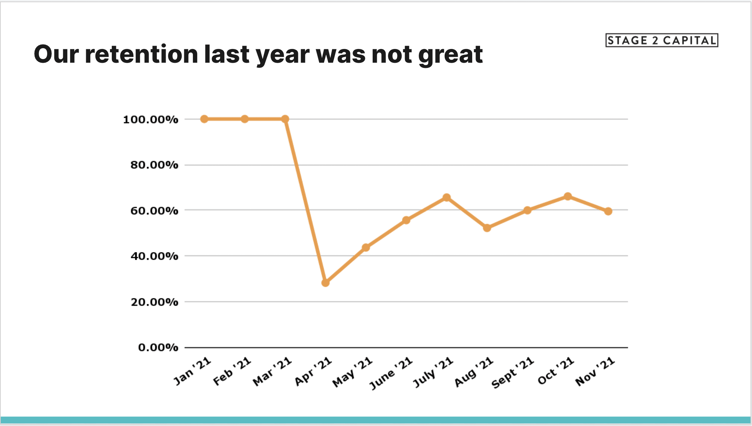
However, hypotheses are hypotheses. They are rarely 100% correct. Therefore, a year later, these entrepreneurs are often left with 60% of their customers realizing the product value they promised and renewing and 40% not realizing the value and churning.

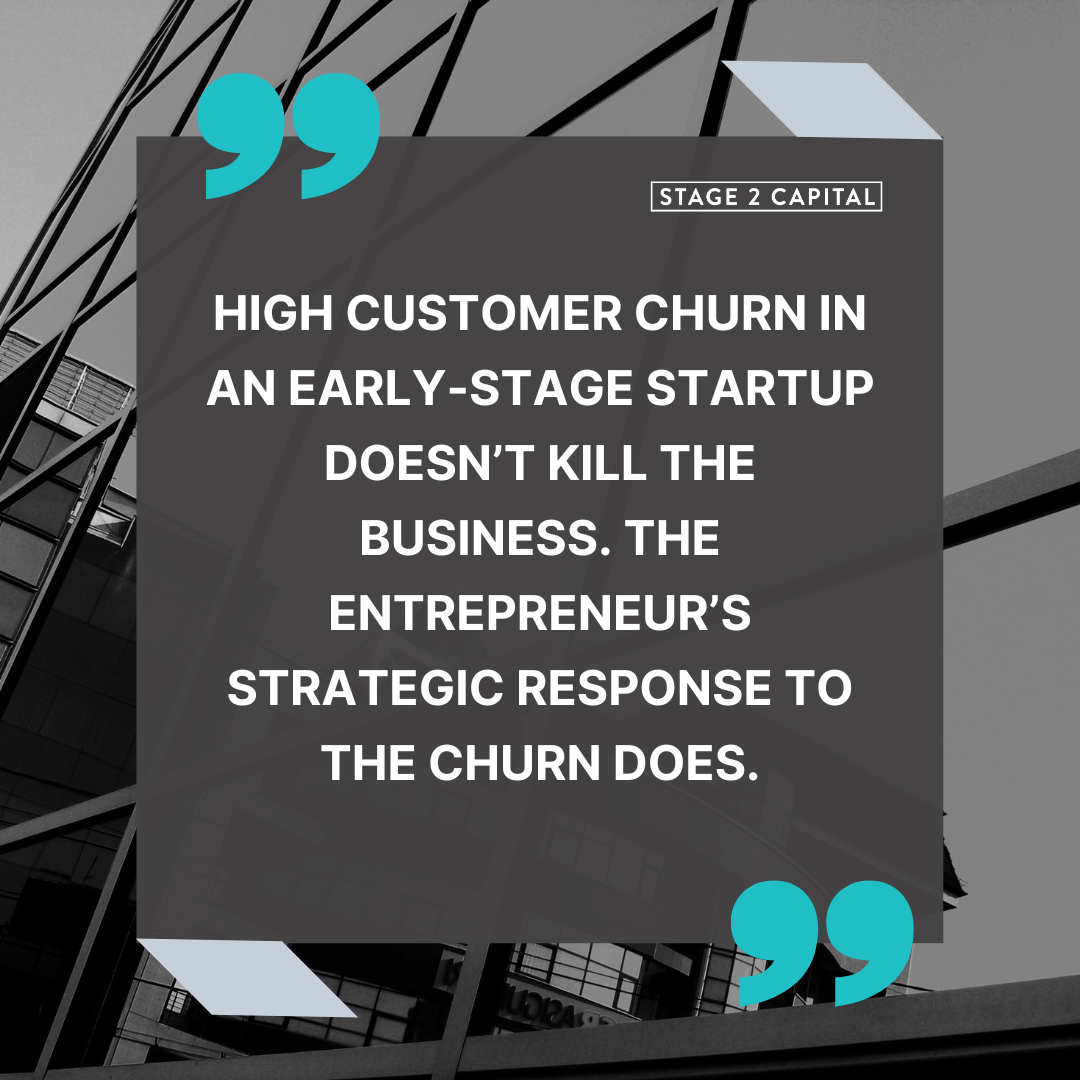
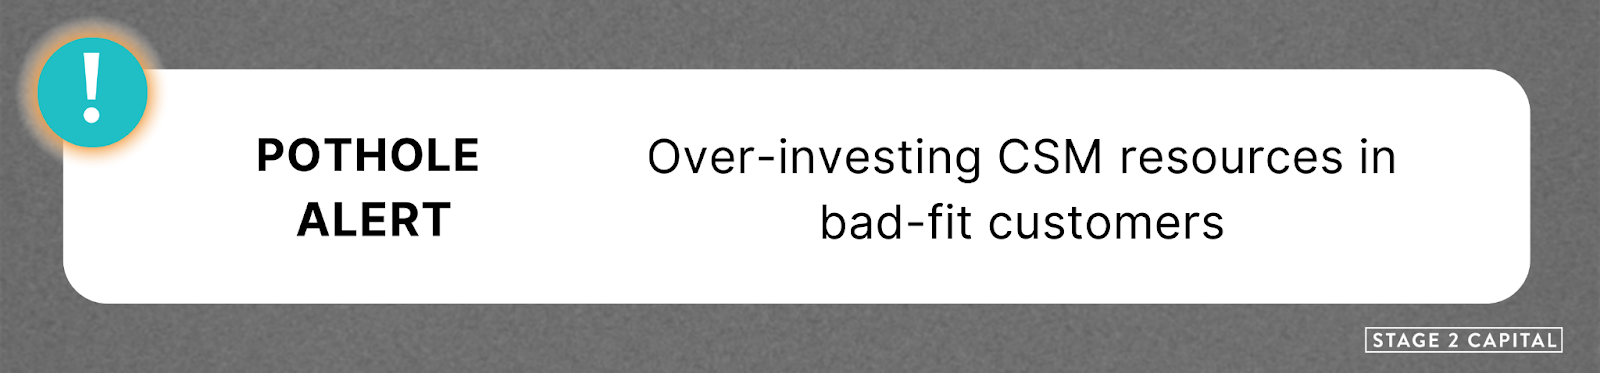
While this outcome sounds really bad, it is the entrepreneur’s strategic response that does the most damage. They stop acquiring new customers and redirect all resources toward fixing churn by saving the entire install base.
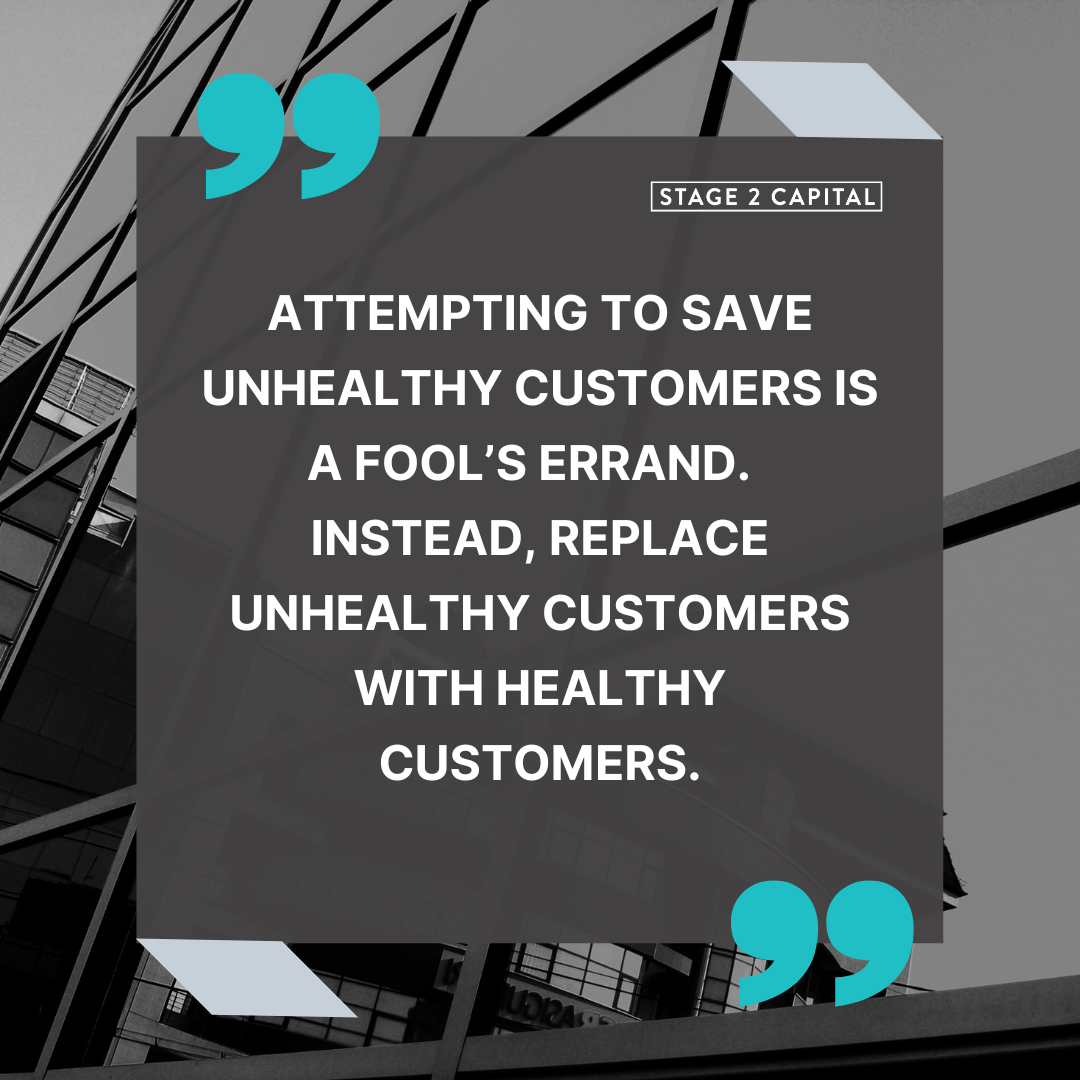
The move sounds logical but here is the issue. 40% of the install base are unhealthy customers. They are not “save-able”. Whether they were sold incorrectly, onboarded sub-optimally, experienced a major bug, or were never a good fit for the product to begin with, their mind is made up.
These customers behave like sunk costs in economic theory. Deploying good resources against these unhealthy customers does not change their inevitable high churn rate. Good resources are wasted on bad opportunities.
the customers are seeing the product value they envisioned and decided to renew. In a pre-IPO context, that is terrible. In a seed staged context, that’s actually quite promising.
So, what should the entrepreneur do?
They should execute this 4-Step retention improvement plan:
- Re-define the Ideal Customer Profile (ICP) Based on Customer Retention: Analyze the customer base to understand patterns in healthy, renewing customers versus unhealthy, churning customers
- Deploy Most CSMs to Customers in the ICP: Deploy most customer success resources on the healthy install base of customers and one or a small number of customer success resources on the unhealthy install base of customers.
- Prevent Future Acquisition of Unhealthy Customers: Align the go-to-market strategy to only sell to the healthy segments of customers going forward
- Forecast When Customer Retention Will Exceed 90%: Calculate when the company will reach 90% customer retention assuming a high churn for the unhealthy install base of customers, a low churn for the healthy install base of customers, and a low churn for all future newly acquired customers.
Below are more details on the execution of each step.
STEP #1: Re-define the Ideal Customer Profile (ICP) Based on Customer Retention:
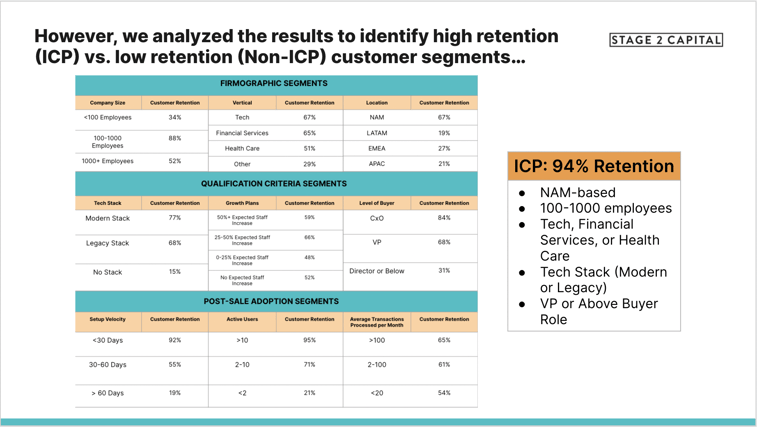
Analyze retention by various customer segments. Look for segments that have relatively high and low retention relative to the average. Segment criteria can be either publicly available firmographics known before the sales process begins, qualification criteria discovered and developed during the sales process, or engagement behaviors observed during post-sale adoption.
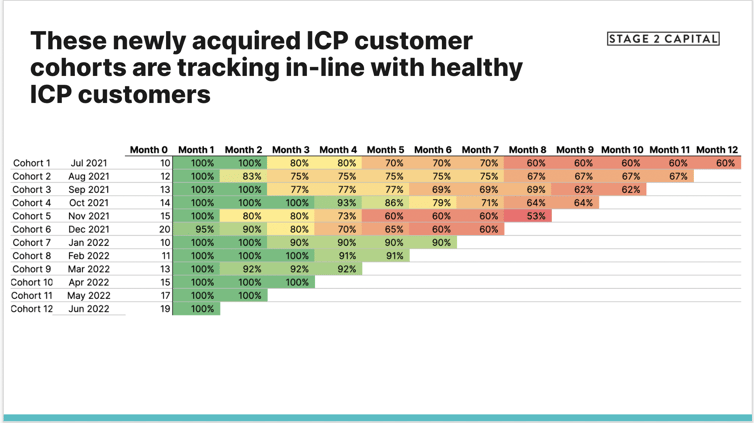
A sample analysis is below: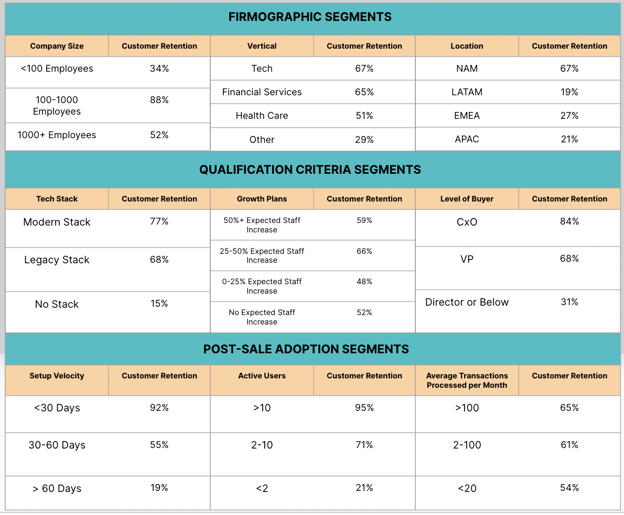
The analysis yields some criteria with high variations in customer retention and other criteria without. Add segments with high variance in customer retention into the ICP definition. Ignore segments with low variation.
Combining the selected segments into a multivariate analysis presents a clearer picture of the ICP: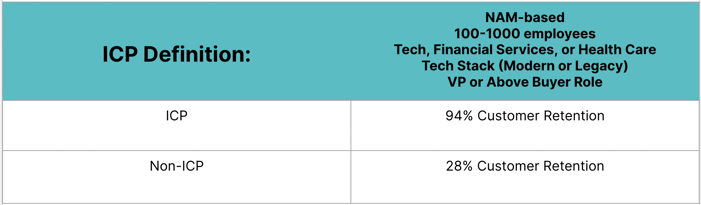

Don’t base the ICP analysis on segments that are easy to sell to (low CAC). Often times the customers that will generate the most success with a product are not the easiest to acquire. Determine which customer segments are successful with the product and then figure out how to optimize the go-to-market strategy to acquire these segments profitably. Doubling down on segments that are easy to sell to, but have high churn, will deepen the retention issue to an unrecoverable state.

The first ICP at the seed stage of a startup does not need to be a billion dollar market. It simply needs to support the next few years of growth, such as getting the company to $20 million in revenue. Yes, most VCs will only invest in startups pursuing a billion dollar TAM. However, they simply need to believe that the startup can expand into markets to support the desired outcome over time. Attempting to prove product-market-fit (PMF) across a wide range of customer segments could dilute the efforts of an already scarce resource pool and prevent achieving PMF in any of them.
STEP #2: Deploy Most CSMs to Customers in the ICP:
Use a scalable customer-to-CSM ratio for ICP customers and a very high customer-to-CSM ratio for non-ICP customers. For example, the startup may use a 20-to-1 customer-to-CSM ratio for ICP customers and a 100-to-1 ratio for non-ICP customers. Don’t completely give up on the non-ICP customers. But also don’t over-invest by deploying high value resource allocation against them. This CSM deployment strategy allows for a balanced approach.
At this stage of a startup, the aggregate retention is less important than the retention in the company’s go-forward ICP. Define the North Star metric as customer retention in the ICP and deploy CSM resources accordingly.
Step #3: Prevent Future Acquisition of Unhealthy Customers:
With the ICP re-defined, entrepreneurs should hold front line resources accountable to only acquiring healthy customers by evolving four components of the go-to-market playbook (1) MQL/SQL definition (2) Pipeline definition (3) Leading Indicator of Retention (4) Sales Compensation Structure.
Align the MQL / SQL Definition with the ICP:
Salespeople cannot acquire unhealthy customers if these leads never enter the funnel. Aligning the MQL definition with the ICP prevents marketing from rotating leads from unhealthy segments into the sales funnel. Aligning the SQL definition with the ICP prevents SDRs from cold calling on prospects from unhealthy segments. Only publicly available firmographic attributes of the ICP can be incorporated into the MQL/SQL definition. In our example analysis above, the MQL/SQL definition would be something like “NAM based companies in the Tech, Financial Services, or Health Care sectors with between 100-1000 employees”.
Add a Customer Success Qualifying Matrix to the Sales Pipeline Definition, Aligned with the ICP:
Most organizations define their sales pipeline using a sales qualifying matrix, like BANT or MEDDIC, which help companies understand the likelihood that a prospect will convert to a customer. Entrepreneurs need to add a customer success qualifying matrix, which helps companies understand whether the prospect will succeed as a customer. The customer success matrix incorporates ICP criteria that are not publicly available but needs to be discovered or developed during the sales process. In our example analysis above, the customer success qualifying matrix would be something like “the prospect has an existing tech stack in place and our primary buyer is a VP title or above”. This criteria should be added to the CRM for entry by sellers and inspection by sales managers. CSMs should be given the authority to reject customers if they do not meet this criteria when they are sold.
Align the Leading Indicator of Retention (LIR) with the ICP. Base Sales Compensation on the LIR:
LIR is a customer behavior that, if observed in the early stages of a customer’s lifecycle with a product, the customer is likely to retain for the long term and, if it is not observed, the customer is likely to churn. I’ve written extensively on defining LIRs in The Science of Scaling, specifically on page 5. The LIR incorporates ICP criteria that are observable during the post-sale onboarding process. In our example analysis above, the LIR would be something like “the customer sets up 2 active users in the first 60 days”. Entrepreneurs should measure CSMs based on this metric. Entrepreneurs should also align sales commissions with the LIR by paying salespeople 50% of their commission when the contract is signed and 50% when the LIR occurs. I’ve also written about this approach extensively on page 13 of the Science of Scaling. The sales compensation adjustment is not meant to turn sellers into CSMs. Instead, it forces sellers to set the proper expectations with prospects during the sales process to do the work necessary to succeed with the product once they buy.
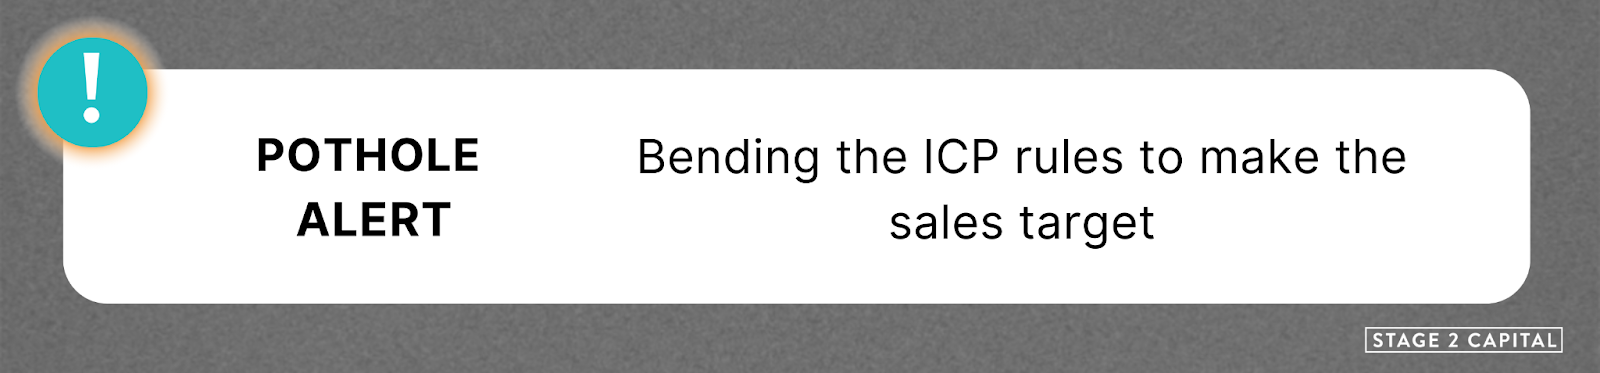
The more a company bends the ICP rules to hit the sales targets, the deeper the churn debt they take on. At this stage, make customer retention the north star, not revenue growth. Get buy-in from the entire company from the board all the way down to the front line. A startup will be much healthier with 85% sales attainment with 100% new customers in the ICP rather than 100% sales attainment and 90% of customers in the ICP.
Step #4: Forecast When Customer Retention Will Exceed 90%:
Calculate when the company will reach 90% customer retention assuming a high churn for the unhealthy install base of customers, a low churn for the healthy install base of customers, and a low churn for all future newly acquired customers.
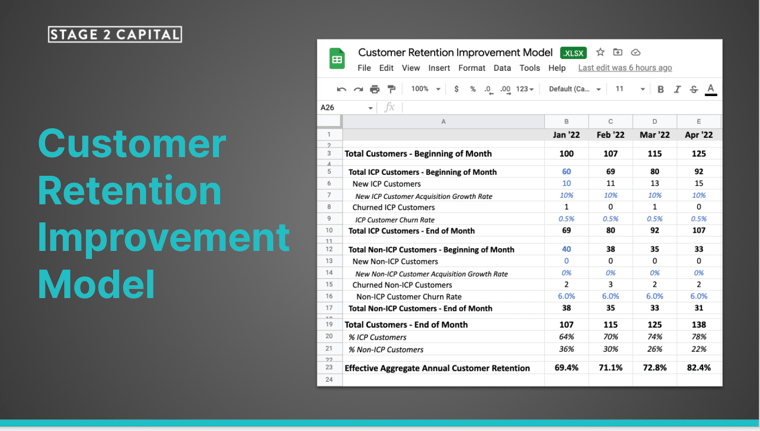
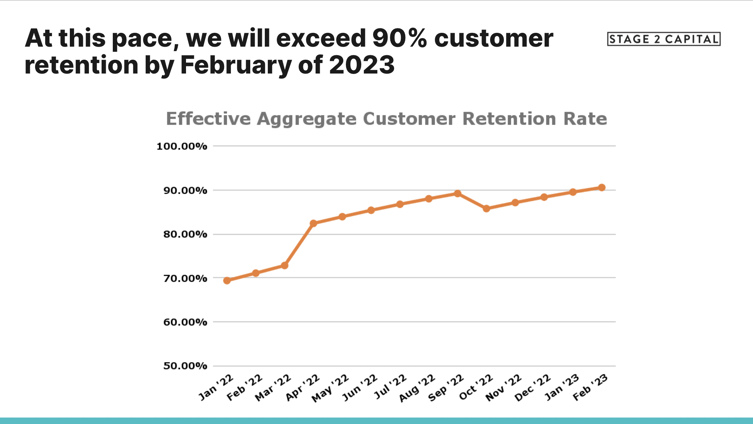
An example model is here. The model is built using the following assumptions:
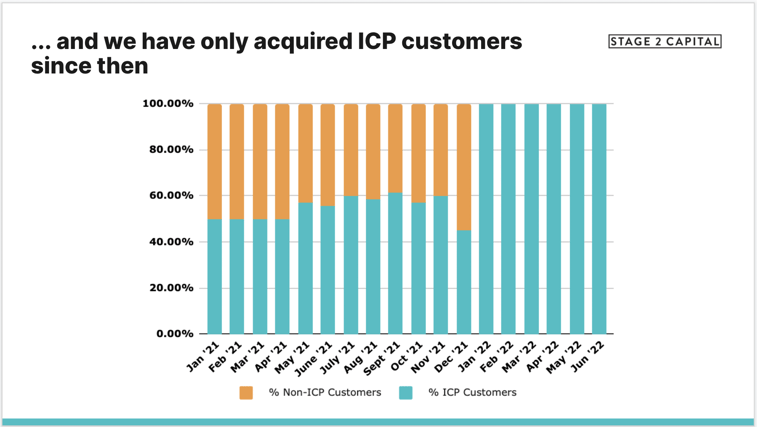
- 100 customers today with 69% in the re-defined ICP and 40% not in the ICP
- 94% annual retention for ICP customers
- 28% annual retention for Non-ICP customers
- New customer acquisition grows by 10% per month
- 100% of customers acquired going forward are in the ICP and have a 94% annual retention
These assumptions yield the below customer retention forecast model. The model illustrates customer retention starting at 64% in January 2022, improving consistently month over month, and finally surpassing 90% in February of 2023.

Be realistic with the assumed churn with non-ICP customers. Take your medicine now while you are resetting the business model. Being too aggressive on the non-ICP retention assumption will tempt good resources to make bad time investment decisions.
The Slide Narrative for Future Investors
With the right customer retention strategy in place, below is the slide narrative entrepreneurs should aim to build out for the next VC fundraise.
SLIDE 1:
SLIDE 2:
SLIDE 3:
SLIDE 4:
SLIDE 5:
These slides are downloadable here if you would like to use them.